Advertisement
Interpump Group's (BIT:IP) five-year total shareholder returns outpace the underlying earnings growth
Generally speaking the aim of active stock picking is to find companies that provide returns that are superior to the market average. And the truth is, you can make significant gains if you buy good quality businesses at the right price. To wit, the Interpump Group share price has climbed 49% in five years, easily topping the market return of 1.2% (ignoring dividends).
Since the long term performance has been good but there's been a recent pullback of 6.6%, let's check if the fundamentals match the share price.
Check out our latest analysis for Interpump Group
While the efficient markets hypothesis continues to be taught by some, it has been proven that markets are over-reactive dynamic systems, and investors are not always rational. One imperfect but simple way to consider how the market perception of a company has shifted is to compare the change in the earnings per share (EPS) with the share price movement.
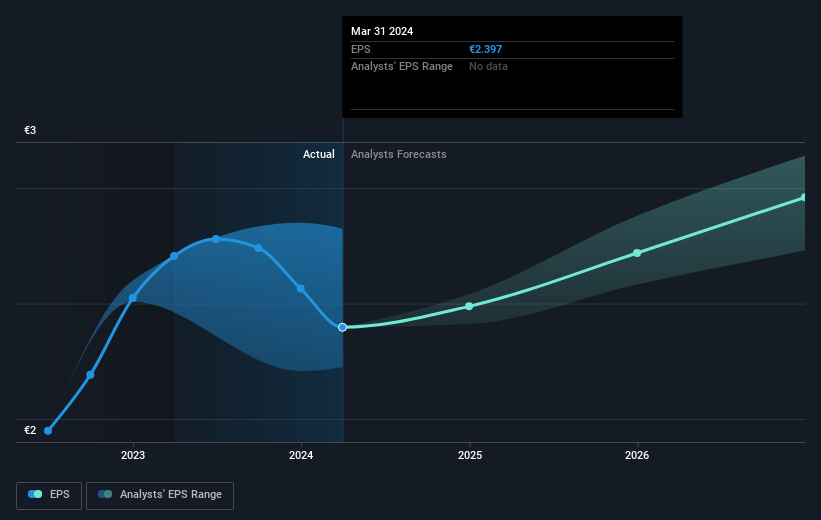
During five years of share price growth, Interpump Group achieved compound earnings per share (EPS) growth of 8.9% per year. This EPS growth is reasonably close to the 8% average annual increase in the share price. This indicates that investor sentiment towards the company has not changed a great deal. Rather, the share price has approximately tracked EPS growth.
The graphic below depicts how EPS has changed over time (unveil the exact values by clicking on the image).
It's probably worth noting that the CEO is paid less than the median at similar sized companies. But while CEO remuneration is always worth checking, the really important question is whether the company can grow earnings going forward. Before buying or selling a stock, we always recommend a close examination of historic growth trends, available here..
What About Dividends?
It is important to consider the total shareholder return, as well as the share price return, for any given stock. Whereas the share price return only reflects the change in the share price, the TSR includes the value of dividends (assuming they were reinvested) and the benefit of any discounted capital raising or spin-off. So for companies that pay a generous dividend, the TSR is often a lot higher than the share price return. We note that for Interpump Group the TSR over the last 5 years was 55%, which is better than the share price return mentioned above. This is largely a result of its dividend payments!
A Different Perspective
Investors in Interpump Group had a tough year, with a total loss of 22% (including dividends), against a market gain of about 19%. Even the share prices of good stocks drop sometimes, but we want to see improvements in the fundamental metrics of a business, before getting too interested. On the bright side, long term shareholders have made money, with a gain of 9% per year over half a decade. It could be that the recent sell-off is an opportunity, so it may be worth checking the fundamental data for signs of a long term growth trend. If you would like to research Interpump Group in more detail then you might want to take a look at whether insiders have been buying or selling shares in the company.
Of course Interpump Group may not be the best stock to buy. So you may wish to see this free collection of growth stocks.
Please note, the market returns quoted in this article reflect the market weighted average returns of stocks that currently trade on Italian exchanges.
New: AI Stock Screener & Alerts
Our new AI Stock Screener scans the market every day to uncover opportunities.
• Dividend Powerhouses (3%+ Yield)
• Undervalued Small Caps with Insider Buying
• High growth Tech and AI Companies
Or build your own from over 50 metrics.
Have feedback on this article? Concerned about the content? Get in touch with us directly. Alternatively, email editorial-team (at) simplywallst.com.
This article by Simply Wall St is general in nature. We provide commentary based on historical data and analyst forecasts only using an unbiased methodology and our articles are not intended to be financial advice. It does not constitute a recommendation to buy or sell any stock, and does not take account of your objectives, or your financial situation. We aim to bring you long-term focused analysis driven by fundamental data. Note that our analysis may not factor in the latest price-sensitive company announcements or qualitative material. Simply Wall St has no position in any stocks mentioned.
Have feedback on this article? Concerned about the content? Get in touch with us directly. Alternatively, email editorial-team@simplywallst.com
About BIT:IP
Interpump Group
Engages in the manufacturing and selling of high-pressure pumps in Italy, rest of Europe, North America, the Far East and the Pacific Area, and internationally.
Flawless balance sheet, good value and pays a dividend.
Market Insights


Advertisement
Weekly Picks
CE


Ceazar on Sparc AI ·
When GPS fails: this small cap is fixing a $54B drone problem
Fair Value:CA$5.2542.9% undervalued
65 followersusers have followed this narrative
0 commentsusers have commented on this narrative
17 likesusers have liked this narrative
HE


HedgeY on IonQ ·
The Best-Funded Quantum Platform and Still a Stock Priced for Perfection
Fair Value:US$487.1% overvalued
27 followersusers have followed this narrative
0 commentsusers have commented on this narrative
7 likesusers have liked this narrative
BL


BlackGoat on Cerebras Systems ·
The Wafer Giant Threatening NVIDIA's GPU Hegemony
Fair Value:US$415.5446.8% undervalued
50 followersusers have followed this narrative
1 commentusers have commented on this narrative
7 likesusers have liked this narrative
IV

Ivoed on Netflix ·
Netflix’s Business Quality Is Clear. The Harder Question Is Whether The Stock Is Still Cheap
Fair Value:US$829.5% undervalued
26 followersusers have followed this narrative
2 commentsusers have commented on this narrative
8 likesusers have liked this narrative
Recently Updated Narratives
PR

Premium_Bobcat_cwey on PayPal Holdings ·
PayPal: PayPal Doesn't Need to Grow – It Needs to Stop Falling – A Mispriced Cash Machine With a Cannibal Buyback
Fair Value:US$6532.2% undervalued
1 followerusers have followed this narrative
0 commentsusers have commented on this narrative
0 likesusers have liked this narrative
WO


woodworthfund on Space Exploration Technologies ·
WHY YOU SHOULD NOT BUY THE SPACEX IPO
Fair Value:US$50215.1% overvalued
1 followerusers have followed this narrative
0 commentsusers have commented on this narrative
0 likesusers have liked this narrative
HI


Hidden_Rock_Capital on Fiserv ·
Temporary "perfect storm" leads to opportunity to buy financial services leader for less than 5x long-term earnings
Fair Value:US$119.9957.7% undervalued
1 followerusers have followed this narrative
0 commentsusers have commented on this narrative
0 likesusers have liked this narrative
Popular Narratives
IN


Investingwilly on Mastercard ·
Mastercard: The Best Dividend Stock You're Ignoring
Fair Value:US$75030.3% undervalued
80 followersusers have followed this narrative
1 commentusers have commented on this narrative
9 likesusers have liked this narrative
HA


HarishPK on Adobe ·
Adobe: A Probabilistic Case for Undervaluation
Fair Value:US$319.9634.1% undervalued
62 followersusers have followed this narrative
9 commentsusers have commented on this narrative
19 likesusers have liked this narrative
MA


martinarauz on Nu Holdings ·
Investment Analysis (May 2026)
Fair Value:US$22.7441.1% undervalued
67 followersusers have followed this narrative
0 commentsusers have commented on this narrative
17 likesusers have liked this narrative


