- Italy
- /
- Construction
- /
- BIT:EDAC
EdiliziAcrobatica's (BIT:EDAC) earnings trajectory could turn positive as the stock soars 15% this past week


This week we saw the EdiliziAcrobatica S.p.A. (BIT:EDAC) share price climb by 15%. But that doesn't help the fact that the three year return is less impressive. After all, the share price is down 55% in the last three years, significantly under-performing the market.
On a more encouraging note the company has added €8.7m to its market cap in just the last 7 days, so let's see if we can determine what's driven the three-year loss for shareholders.
See our latest analysis for EdiliziAcrobatica
In his essay The Superinvestors of Graham-and-Doddsville Warren Buffett described how share prices do not always rationally reflect the value of a business. One way to examine how market sentiment has changed over time is to look at the interaction between a company's share price and its earnings per share (EPS).
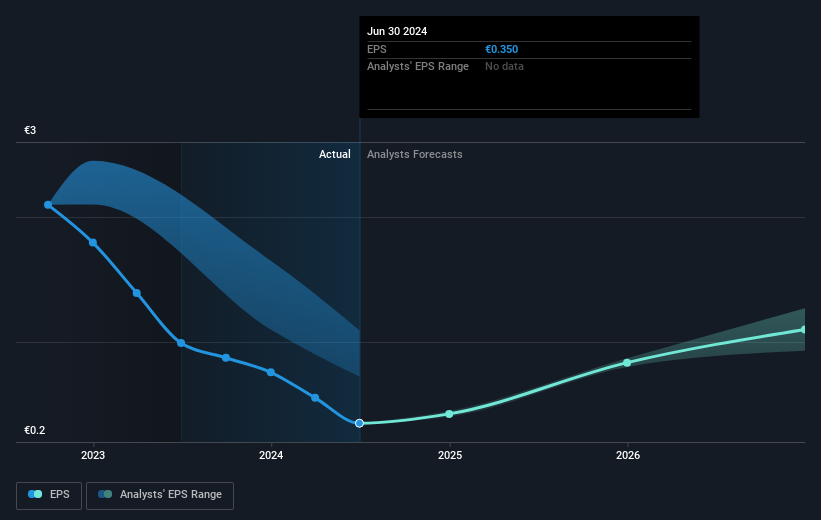
During the three years that the share price fell, EdiliziAcrobatica's earnings per share (EPS) dropped by 5.8% each year. This reduction in EPS is slower than the 23% annual reduction in the share price. So it seems the market was too confident about the business, in the past.
The image below shows how EPS has tracked over time (if you click on the image you can see greater detail).
It might be well worthwhile taking a look at our free report on EdiliziAcrobatica's earnings, revenue and cash flow.
What About Dividends?
It is important to consider the total shareholder return, as well as the share price return, for any given stock. The TSR incorporates the value of any spin-offs or discounted capital raisings, along with any dividends, based on the assumption that the dividends are reinvested. So for companies that pay a generous dividend, the TSR is often a lot higher than the share price return. As it happens, EdiliziAcrobatica's TSR for the last 3 years was -49%, which exceeds the share price return mentioned earlier. And there's no prize for guessing that the dividend payments largely explain the divergence!
A Different Perspective
Investors in EdiliziAcrobatica had a tough year, with a total loss of 31% (including dividends), against a market gain of about 30%. Even the share prices of good stocks drop sometimes, but we want to see improvements in the fundamental metrics of a business, before getting too interested. On the bright side, long term shareholders have made money, with a gain of 6% per year over half a decade. If the fundamental data continues to indicate long term sustainable growth, the current sell-off could be an opportunity worth considering. It's always interesting to track share price performance over the longer term. But to understand EdiliziAcrobatica better, we need to consider many other factors. Take risks, for example - EdiliziAcrobatica has 3 warning signs we think you should be aware of.
Of course, you might find a fantastic investment by looking elsewhere. So take a peek at this free list of companies we expect will grow earnings.
Please note, the market returns quoted in this article reflect the market weighted average returns of stocks that currently trade on Italian exchanges.
Valuation is complex, but we're here to simplify it.
Discover if EdiliziAcrobatica might be undervalued or overvalued with our detailed analysis, featuring fair value estimates, potential risks, dividends, insider trades, and its financial condition.
Access Free AnalysisHave feedback on this article? Concerned about the content? Get in touch with us directly. Alternatively, email editorial-team (at) simplywallst.com.
This article by Simply Wall St is general in nature. We provide commentary based on historical data and analyst forecasts only using an unbiased methodology and our articles are not intended to be financial advice. It does not constitute a recommendation to buy or sell any stock, and does not take account of your objectives, or your financial situation. We aim to bring you long-term focused analysis driven by fundamental data. Note that our analysis may not factor in the latest price-sensitive company announcements or qualitative material. Simply Wall St has no position in any stocks mentioned.
About BIT:EDAC
Flawless balance sheet with reasonable growth potential.
