
Advertisement
- Italy
- /
- Construction
- /
- BIT:EDAC
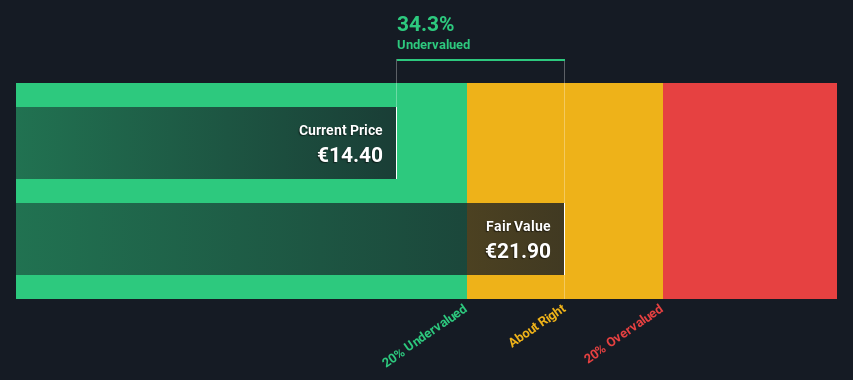
An Intrinsic Calculation For EdiliziAcrobatica S.p.A. (BIT:EDAC) Suggests It's 34% Undervalued
Key Insights
- Using the 2 Stage Free Cash Flow to Equity, EdiliziAcrobatica fair value estimate is €21.90
- Current share price of €14.40 suggests EdiliziAcrobatica is potentially 34% undervalued
- Peers of EdiliziAcrobatica are currently trading on average at a 104% premium
How far off is EdiliziAcrobatica S.p.A. (BIT:EDAC) from its intrinsic value? Using the most recent financial data, we'll take a look at whether the stock is fairly priced by estimating the company's future cash flows and discounting them to their present value. The Discounted Cash Flow (DCF) model is the tool we will apply to do this. Believe it or not, it's not too difficult to follow, as you'll see from our example!
Companies can be valued in a lot of ways, so we would point out that a DCF is not perfect for every situation. Anyone interested in learning a bit more about intrinsic value should have a read of the Simply Wall St analysis model.
See our latest analysis for EdiliziAcrobatica
Is EdiliziAcrobatica Fairly Valued?
We use what is known as a 2-stage model, which simply means we have two different periods of growth rates for the company's cash flows. Generally the first stage is higher growth, and the second stage is a lower growth phase. To begin with, we have to get estimates of the next ten years of cash flows. Where possible we use analyst estimates, but when these aren't available we extrapolate the previous free cash flow (FCF) from the last estimate or reported value. We assume companies with shrinking free cash flow will slow their rate of shrinkage, and that companies with growing free cash flow will see their growth rate slow, over this period. We do this to reflect that growth tends to slow more in the early years than it does in later years.
Generally we assume that a dollar today is more valuable than a dollar in the future, so we need to discount the sum of these future cash flows to arrive at a present value estimate:
10-year free cash flow (FCF) estimate
| 2024 | 2025 | 2026 | 2027 | 2028 | 2029 | 2030 | 2031 | 2032 | 2033 | |
| Levered FCF (€, Millions) | €13.4m | €15.0m | €16.1m | €17.1m | €18.0m | €18.7m | €19.4m | €20.0m | €20.6m | €21.1m |
| Growth Rate Estimate Source | Analyst x2 | Analyst x2 | Est @ 7.93% | Est @ 6.20% | Est @ 4.98% | Est @ 4.13% | Est @ 3.54% | Est @ 3.12% | Est @ 2.83% | Est @ 2.63% |
| Present Value (€, Millions) Discounted @ 11% | €12.0 | €12.1 | €11.7 | €11.2 | €10.5 | €9.9 | €9.2 | €8.5 | €7.9 | €7.2 |
("Est" = FCF growth rate estimated by Simply Wall St)
Present Value of 10-year Cash Flow (PVCF) = €100m
The second stage is also known as Terminal Value, this is the business's cash flow after the first stage. For a number of reasons a very conservative growth rate is used that cannot exceed that of a country's GDP growth. In this case we have used the 5-year average of the 10-year government bond yield (2.2%) to estimate future growth. In the same way as with the 10-year 'growth' period, we discount future cash flows to today's value, using a cost of equity of 11%.
Terminal Value (TV)= FCF2033 × (1 + g) ÷ (r – g) = €21m× (1 + 2.2%) ÷ (11%– 2.2%) = €236m
Present Value of Terminal Value (PVTV)= TV / (1 + r)10= €236m÷ ( 1 + 11%)10= €81m
The total value, or equity value, is then the sum of the present value of the future cash flows, which in this case is €181m. The last step is to then divide the equity value by the number of shares outstanding. Compared to the current share price of €14.4, the company appears quite good value at a 34% discount to where the stock price trades currently. The assumptions in any calculation have a big impact on the valuation, so it is better to view this as a rough estimate, not precise down to the last cent.
Important Assumptions
Now the most important inputs to a discounted cash flow are the discount rate, and of course, the actual cash flows. You don't have to agree with these inputs, I recommend redoing the calculations yourself and playing with them. The DCF also does not consider the possible cyclicality of an industry, or a company's future capital requirements, so it does not give a full picture of a company's potential performance. Given that we are looking at EdiliziAcrobatica as potential shareholders, the cost of equity is used as the discount rate, rather than the cost of capital (or weighted average cost of capital, WACC) which accounts for debt. In this calculation we've used 11%, which is based on a levered beta of 1.097. Beta is a measure of a stock's volatility, compared to the market as a whole. We get our beta from the industry average beta of globally comparable companies, with an imposed limit between 0.8 and 2.0, which is a reasonable range for a stable business.
SWOT Analysis for EdiliziAcrobatica
Strength
- Debt is not viewed as a risk.
- Dividends are covered by earnings and cash flows.
- Dividend is in the top 25% of dividend payers in the market.
Weakness
- Earnings growth over the past year underperformed the Construction industry.
Opportunity
- Annual earnings are forecast to grow faster than the Italian market.
- Good value based on P/E ratio and estimated fair value.
Threat
- No apparent threats visible for EDAC.
Next Steps:
Whilst important, the DCF calculation is only one of many factors that you need to assess for a company. The DCF model is not a perfect stock valuation tool. Preferably you'd apply different cases and assumptions and see how they would impact the company's valuation. If a company grows at a different rate, or if its cost of equity or risk free rate changes sharply, the output can look very different. Why is the intrinsic value higher than the current share price? For EdiliziAcrobatica, there are three further elements you should consider:
- Risks: Case in point, we've spotted 1 warning sign for EdiliziAcrobatica you should be aware of.
- Future Earnings: How does EDAC's growth rate compare to its peers and the wider market? Dig deeper into the analyst consensus number for the upcoming years by interacting with our free analyst growth expectation chart.
- Other Solid Businesses: Low debt, high returns on equity and good past performance are fundamental to a strong business. Why not explore our interactive list of stocks with solid business fundamentals to see if there are other companies you may not have considered!
PS. Simply Wall St updates its DCF calculation for every Italian stock every day, so if you want to find the intrinsic value of any other stock just search here.
Valuation is complex, but we're here to simplify it.
Discover if EdiliziAcrobatica might be undervalued or overvalued with our detailed analysis, featuring fair value estimates, potential risks, dividends, insider trades, and its financial condition.
Access Free AnalysisHave feedback on this article? Concerned about the content? Get in touch with us directly. Alternatively, email editorial-team (at) simplywallst.com.
This article by Simply Wall St is general in nature. We provide commentary based on historical data and analyst forecasts only using an unbiased methodology and our articles are not intended to be financial advice. It does not constitute a recommendation to buy or sell any stock, and does not take account of your objectives, or your financial situation. We aim to bring you long-term focused analysis driven by fundamental data. Note that our analysis may not factor in the latest price-sensitive company announcements or qualitative material. Simply Wall St has no position in any stocks mentioned.
About BIT:EDAC
EdiliziAcrobatica
Engages in outdoor construction works in Italy, France, Spain, Monaco, and the United Arab Emirates.
Very undervalued with reasonable growth potential.
Similar Companies
Market Insights

Advertisement
Community Narratives
MicroVision will explode future revenue by 380.37% with a vision towards success
Fair Value US$60.00|98.5% undervalued
TH
Community Contributor
The Indispensable Artery for a New North American Economy
Fair Value CA$132.87|2.3% undervalued
TI
Community Contributor