Stock Analysis
Is Stellantis N.V.'s (BIT:STLAM) Latest Stock Performance A Reflection Of Its Financial Health?


Stellantis (BIT:STLAM) has had a great run on the share market with its stock up by a significant 19% over the last three months. Given that the market rewards strong financials in the long-term, we wonder if that is the case in this instance. In this article, we decided to focus on Stellantis' ROE.
Return on equity or ROE is a key measure used to assess how efficiently a company's management is utilizing the company's capital. In simpler terms, it measures the profitability of a company in relation to shareholder's equity.
View our latest analysis for Stellantis
How To Calculate Return On Equity?
The formula for ROE is:
Return on Equity = Net Profit (from continuing operations) ÷ Shareholders' Equity
So, based on the above formula, the ROE for Stellantis is:
23% = €19b ÷ €82b (Based on the trailing twelve months to December 2023).
The 'return' is the income the business earned over the last year. Another way to think of that is that for every €1 worth of equity, the company was able to earn €0.23 in profit.
What Is The Relationship Between ROE And Earnings Growth?
So far, we've learned that ROE is a measure of a company's profitability. Depending on how much of these profits the company reinvests or "retains", and how effectively it does so, we are then able to assess a company’s earnings growth potential. Assuming everything else remains unchanged, the higher the ROE and profit retention, the higher the growth rate of a company compared to companies that don't necessarily bear these characteristics.
Stellantis' Earnings Growth And 23% ROE
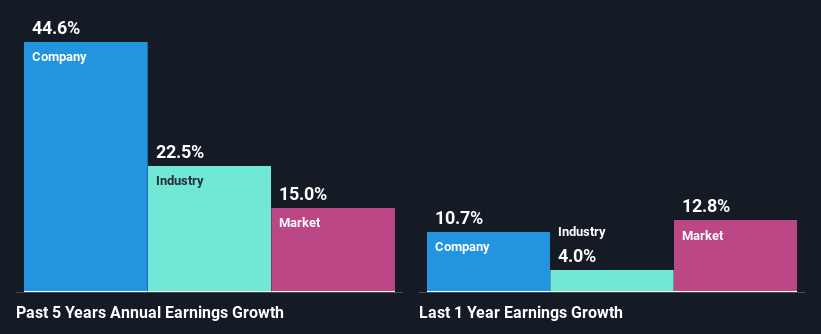
Firstly, we acknowledge that Stellantis has a significantly high ROE. Second, a comparison with the average ROE reported by the industry of 15% also doesn't go unnoticed by us. As a result, Stellantis' exceptional 45% net income growth seen over the past five years, doesn't come as a surprise.
As a next step, we compared Stellantis' net income growth with the industry, and pleasingly, we found that the growth seen by the company is higher than the average industry growth of 22%.
The basis for attaching value to a company is, to a great extent, tied to its earnings growth. It’s important for an investor to know whether the market has priced in the company's expected earnings growth (or decline). This then helps them determine if the stock is placed for a bright or bleak future. One good indicator of expected earnings growth is the P/E ratio which determines the price the market is willing to pay for a stock based on its earnings prospects. So, you may want to check if Stellantis is trading on a high P/E or a low P/E, relative to its industry.
Is Stellantis Efficiently Re-investing Its Profits?
Stellantis' three-year median payout ratio to shareholders is 22%, which is quite low. This implies that the company is retaining 78% of its profits. This suggests that the management is reinvesting most of the profits to grow the business as evidenced by the growth seen by the company.
While Stellantis has been growing its earnings, it only recently started to pay dividends which likely means that the company decided to impress new and existing shareholders with a dividend. Our latest analyst data shows that the future payout ratio of the company is expected to rise to 28% over the next three years. Consequently, the higher expected payout ratio explains the decline in the company's expected ROE (to 16%) over the same period.
Conclusion
In total, we are pretty happy with Stellantis' performance. Specifically, we like that the company is reinvesting a huge chunk of its profits at a high rate of return. This of course has caused the company to see substantial growth in its earnings. With that said, on studying the latest analyst forecasts, we found that while the company has seen growth in its past earnings, analysts expect its future earnings to shrink. Are these analysts expectations based on the broad expectations for the industry, or on the company's fundamentals? Click here to be taken to our analyst's forecasts page for the company.
Valuation is complex, but we're helping make it simple.
Find out whether Stellantis is potentially over or undervalued by checking out our comprehensive analysis, which includes fair value estimates, risks and warnings, dividends, insider transactions and financial health.
View the Free AnalysisHave feedback on this article? Concerned about the content? Get in touch with us directly. Alternatively, email editorial-team (at) simplywallst.com.
This article by Simply Wall St is general in nature. We provide commentary based on historical data and analyst forecasts only using an unbiased methodology and our articles are not intended to be financial advice. It does not constitute a recommendation to buy or sell any stock, and does not take account of your objectives, or your financial situation. We aim to bring you long-term focused analysis driven by fundamental data. Note that our analysis may not factor in the latest price-sensitive company announcements or qualitative material. Simply Wall St has no position in any stocks mentioned.
About BIT:STLAM
Stellantis
Stellantis N.V. engages in the design, engineering, manufacturing, distribution, and sale of automobiles and light commercial vehicles, engines, transmission systems, metallurgical products, mobility services, and production systems worldwide.
Flawless balance sheet with solid track record and pays a dividend.
