
Advertisement
- India
- /
- Electric Utilities
- /
- NSEI:SJVN
Despite lower earnings than five years ago, SJVN (NSE:SJVN) investors are up 603% since then
SJVN Limited (NSE:SJVN) shareholders might be concerned after seeing the share price drop 11% in the last quarter. But that doesn't undermine the fantastic longer term performance (measured over five years). In that time, the share price has soared some 429% higher! So we don't think the recent decline in the share price means its story is a sad one. But the real question is whether the business fundamentals can improve over the long term.
Although SJVN has shed ₹28b from its market cap this week, let's take a look at its longer term fundamental trends and see if they've driven returns.
See our latest analysis for SJVN
While the efficient markets hypothesis continues to be taught by some, it has been proven that markets are over-reactive dynamic systems, and investors are not always rational. One imperfect but simple way to consider how the market perception of a company has shifted is to compare the change in the earnings per share (EPS) with the share price movement.
SJVN's earnings per share are down 7.9% per year, despite strong share price performance over five years.
This means it's unlikely the market is judging the company based on earnings growth. Since the change in EPS doesn't seem to correlate with the change in share price, it's worth taking a look at other metrics.
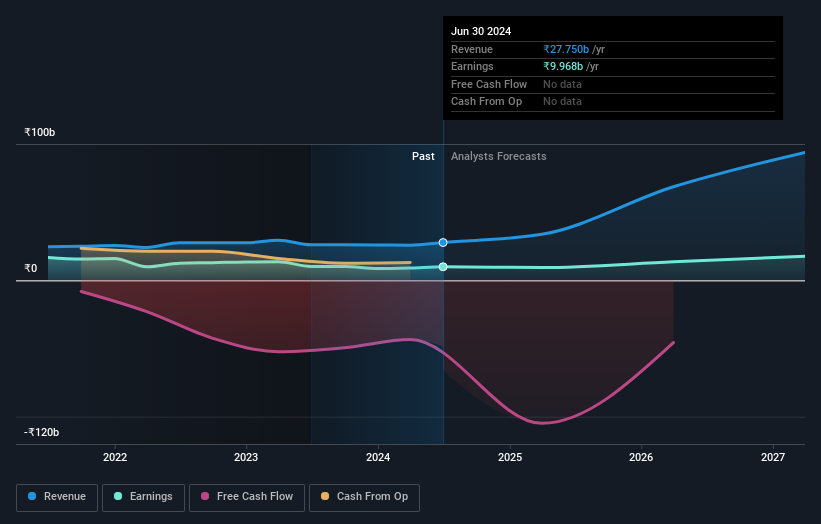
We doubt the modest 1.4% dividend yield is attracting many buyers to the stock. It is not great to see that revenue has dropped by 0.6% per year over five years. It certainly surprises us that the share price is up, but perhaps a closer examination of the data will yield answers.
The graphic below depicts how earnings and revenue have changed over time (unveil the exact values by clicking on the image).
This free interactive report on SJVN's balance sheet strength is a great place to start, if you want to investigate the stock further.
What About Dividends?
It is important to consider the total shareholder return, as well as the share price return, for any given stock. The TSR incorporates the value of any spin-offs or discounted capital raisings, along with any dividends, based on the assumption that the dividends are reinvested. It's fair to say that the TSR gives a more complete picture for stocks that pay a dividend. In the case of SJVN, it has a TSR of 603% for the last 5 years. That exceeds its share price return that we previously mentioned. This is largely a result of its dividend payments!
A Different Perspective
We're pleased to report that SJVN shareholders have received a total shareholder return of 77% over one year. Of course, that includes the dividend. That gain is better than the annual TSR over five years, which is 48%. Therefore it seems like sentiment around the company has been positive lately. In the best case scenario, this may hint at some real business momentum, implying that now could be a great time to delve deeper. It's always interesting to track share price performance over the longer term. But to understand SJVN better, we need to consider many other factors. Case in point: We've spotted 2 warning signs for SJVN you should be aware of, and 1 of them is a bit concerning.
But note: SJVN may not be the best stock to buy. So take a peek at this free list of interesting companies with past earnings growth (and further growth forecast).
Please note, the market returns quoted in this article reflect the market weighted average returns of stocks that currently trade on Indian exchanges.
New: Manage All Your Stock Portfolios in One Place
We've created the ultimate portfolio companion for stock investors, and it's free.
• Connect an unlimited number of Portfolios and see your total in one currency
• Be alerted to new Warning Signs or Risks via email or mobile
• Track the Fair Value of your stocks
Have feedback on this article? Concerned about the content? Get in touch with us directly. Alternatively, email editorial-team (at) simplywallst.com.
This article by Simply Wall St is general in nature. We provide commentary based on historical data and analyst forecasts only using an unbiased methodology and our articles are not intended to be financial advice. It does not constitute a recommendation to buy or sell any stock, and does not take account of your objectives, or your financial situation. We aim to bring you long-term focused analysis driven by fundamental data. Note that our analysis may not factor in the latest price-sensitive company announcements or qualitative material. Simply Wall St has no position in any stocks mentioned.
About NSEI:SJVN
SJVN
Engages in the generation and sale of electricity in India and internationally.
High growth potential average dividend payer.
Similar Companies
Market Insights

Advertisement
Community Narratives
The company that turned a verb into a global necessity and basically runs the modern internet, digital ads, smartphones, maps, and AI.
Fair Value US$300.00|6.3% undervalued
OS
Community Contributor
Flowers Foods Pays A Fair Price For Health
Fair Value US$16.12|26.0% undervalued
NV
Community Contributor
TMX Group will thrive with 33.3% profit margin and enduring market moat
Fair Value CA$49.90|3.7% overvalued
LI
Community Contributor