
Advertisement
Capital Investment Trends At Blue Dart Express (NSE:BLUEDART) Look Strong
If you're not sure where to start when looking for the next multi-bagger, there are a few key trends you should keep an eye out for. In a perfect world, we'd like to see a company investing more capital into its business and ideally the returns earned from that capital are also increasing. Put simply, these types of businesses are compounding machines, meaning they are continually reinvesting their earnings at ever-higher rates of return. That's why when we briefly looked at Blue Dart Express' (NSE:BLUEDART) ROCE trend, we were very happy with what we saw.
Understanding Return On Capital Employed (ROCE)
Just to clarify if you're unsure, ROCE is a metric for evaluating how much pre-tax income (in percentage terms) a company earns on the capital invested in its business. The formula for this calculation on Blue Dart Express is:
Return on Capital Employed = Earnings Before Interest and Tax (EBIT) ÷ (Total Assets - Current Liabilities)
0.29 = ₹4.7b ÷ (₹29b - ₹13b) (Based on the trailing twelve months to June 2021).
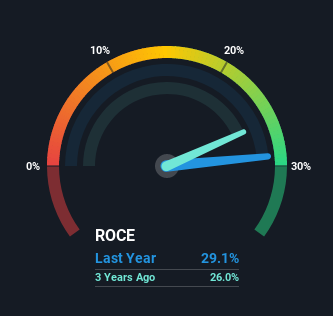
So, Blue Dart Express has an ROCE of 29%. That's a fantastic return and not only that, it outpaces the average of 15% earned by companies in a similar industry.
See our latest analysis for Blue Dart Express
Above you can see how the current ROCE for Blue Dart Express compares to its prior returns on capital, but there's only so much you can tell from the past. If you'd like, you can check out the forecasts from the analysts covering Blue Dart Express here for free.
What Does the ROCE Trend For Blue Dart Express Tell Us?
It's hard not to be impressed by Blue Dart Express' returns on capital. The company has employed 83% more capital in the last five years, and the returns on that capital have remained stable at 29%. Now considering ROCE is an attractive 29%, this combination is actually pretty appealing because it means the business can consistently put money to work and generate these high returns. If these trends can continue, it wouldn't surprise us if the company became a multi-bagger.
On another note, while the change in ROCE trend might not scream for attention, it's interesting that the current liabilities have actually gone up over the last five years. This is intriguing because if current liabilities hadn't increased to 45% of total assets, this reported ROCE would probably be less than29% because total capital employed would be higher.The 29% ROCE could be even lower if current liabilities weren't 45% of total assets, because the the formula would show a larger base of total capital employed. Additionally, this high level of current liabilities isn't ideal because it means the company's suppliers (or short-term creditors) are effectively funding a large portion of the business.
In Conclusion...
In the end, the company has proven it can reinvest it's capital at high rates of returns, which you'll remember is a trait of a multi-bagger. However, over the last five years, the stock has only delivered a 24% return to shareholders who held over that period. So to determine if Blue Dart Express is a multi-bagger going forward, we'd suggest digging deeper into the company's other fundamentals.
One more thing to note, we've identified 1 warning sign with Blue Dart Express and understanding it should be part of your investment process.
If you want to search for more stocks that have been earning high returns, check out this free list of stocks with solid balance sheets that are also earning high returns on equity.
Valuation is complex, but we're here to simplify it.
Discover if Blue Dart Express might be undervalued or overvalued with our detailed analysis, featuring fair value estimates, potential risks, dividends, insider trades, and its financial condition.
Access Free AnalysisThis article by Simply Wall St is general in nature. We provide commentary based on historical data and analyst forecasts only using an unbiased methodology and our articles are not intended to be financial advice. It does not constitute a recommendation to buy or sell any stock, and does not take account of your objectives, or your financial situation. We aim to bring you long-term focused analysis driven by fundamental data. Note that our analysis may not factor in the latest price-sensitive company announcements or qualitative material. Simply Wall St has no position in any stocks mentioned.
Have feedback on this article? Concerned about the content? Get in touch with us directly. Alternatively, email editorial-team (at) simplywallst.com.
About NSEI:BLUEDART
Flawless balance sheet with reasonable growth potential and pays a dividend.
Similar Companies
Market Insights

Advertisement
Community Narratives
MicroVision will explode future revenue by 380.37% with a vision towards success
Fair Value US$60.00|98.4% undervalued
TH
Community Contributor
The Indispensable Artery for a New North American Economy
Fair Value CA$132.87|1.3% undervalued
TI
Community Contributor