
Advertisement
- India
- /
- Electronic Equipment and Components
- /
- NSEI:SYRMA
Syrma SGS Technology (NSE:SYRMA) Has A Pretty Healthy Balance Sheet
Warren Buffett famously said, 'Volatility is far from synonymous with risk.' So it might be obvious that you need to consider debt, when you think about how risky any given stock is, because too much debt can sink a company. We note that Syrma SGS Technology Limited (NSE:SYRMA) does have debt on its balance sheet. But is this debt a concern to shareholders?
When Is Debt Dangerous?
Generally speaking, debt only becomes a real problem when a company can't easily pay it off, either by raising capital or with its own cash flow. In the worst case scenario, a company can go bankrupt if it cannot pay its creditors. However, a more frequent (but still costly) occurrence is where a company must issue shares at bargain-basement prices, permanently diluting shareholders, just to shore up its balance sheet. By replacing dilution, though, debt can be an extremely good tool for businesses that need capital to invest in growth at high rates of return. The first step when considering a company's debt levels is to consider its cash and debt together.
What Is Syrma SGS Technology's Debt?
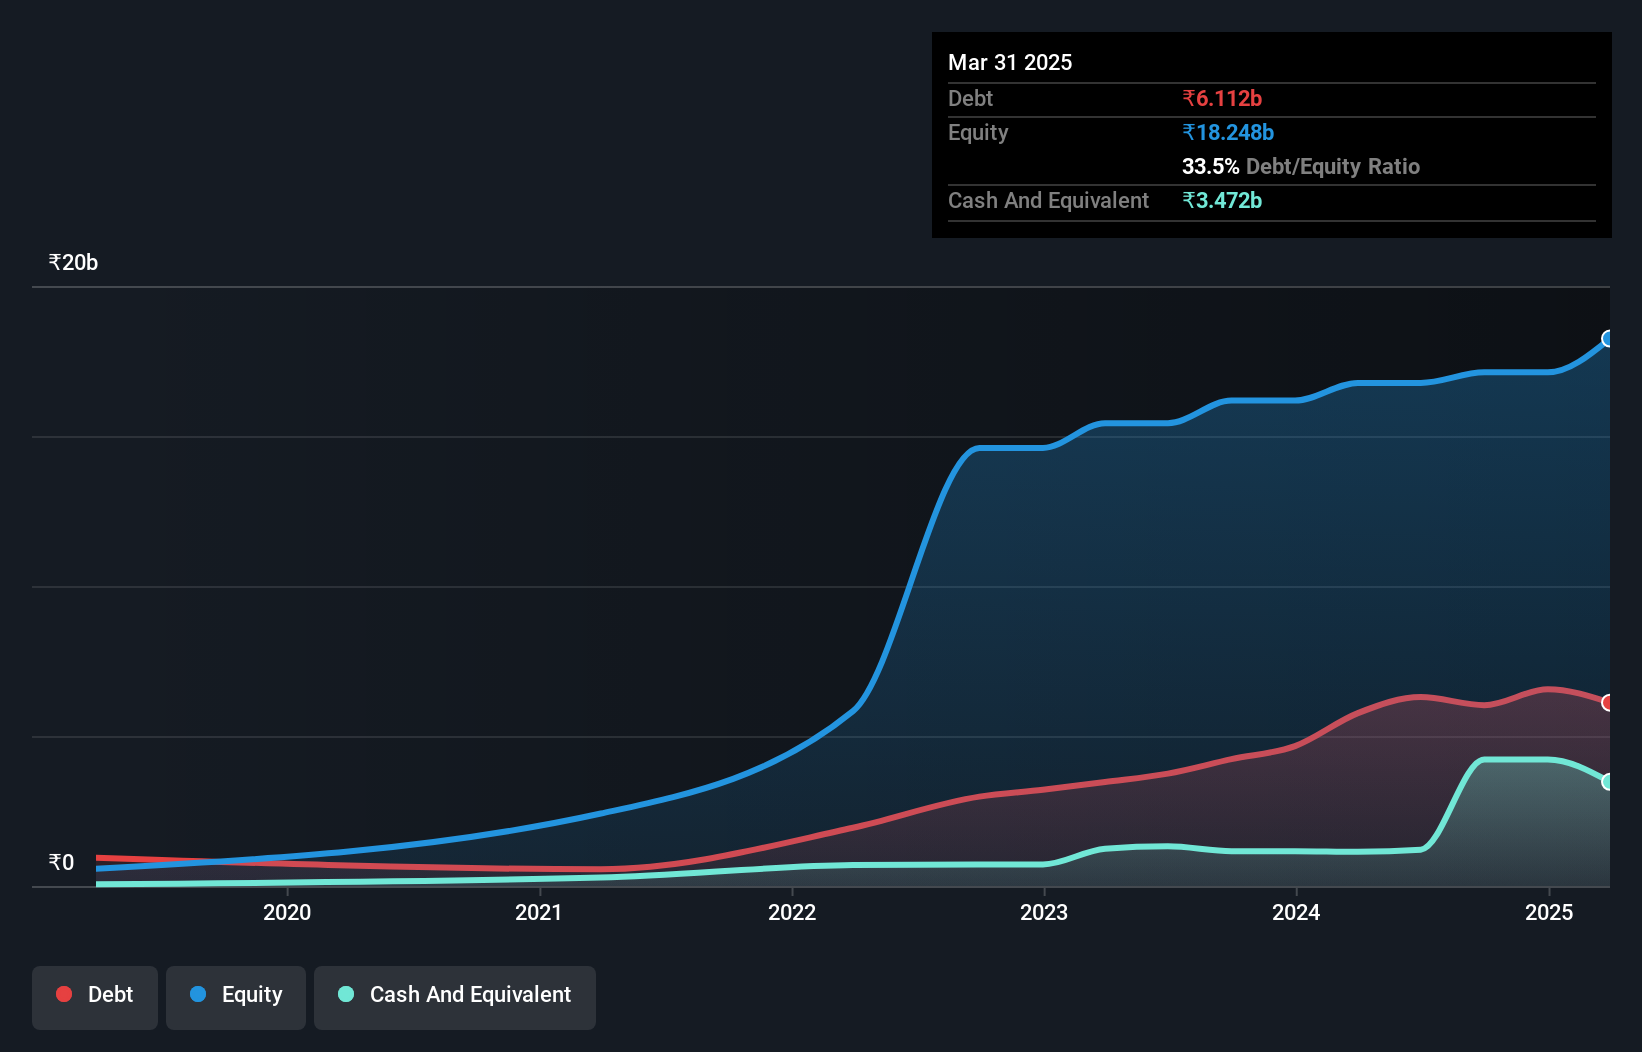
The image below, which you can click on for greater detail, shows that at March 2025 Syrma SGS Technology had debt of ₹6.11b, up from ₹5.76b in one year. However, it also had ₹3.47b in cash, and so its net debt is ₹2.64b.
A Look At Syrma SGS Technology's Liabilities
According to the last reported balance sheet, Syrma SGS Technology had liabilities of ₹22.1b due within 12 months, and liabilities of ₹1.66b due beyond 12 months. On the other hand, it had cash of ₹3.47b and ₹14.8b worth of receivables due within a year. So its liabilities outweigh the sum of its cash and (near-term) receivables by ₹5.55b.
Of course, Syrma SGS Technology has a market capitalization of ₹108.5b, so these liabilities are probably manageable. However, we do think it is worth keeping an eye on its balance sheet strength, as it may change over time.
Check out our latest analysis for Syrma SGS Technology
In order to size up a company's debt relative to its earnings, we calculate its net debt divided by its earnings before interest, tax, depreciation, and amortization (EBITDA) and its earnings before interest and tax (EBIT) divided by its interest expense (its interest cover). Thus we consider debt relative to earnings both with and without depreciation and amortization expenses.
While Syrma SGS Technology's low debt to EBITDA ratio of 0.82 suggests only modest use of debt, the fact that EBIT only covered the interest expense by 4.2 times last year does give us pause. But the interest payments are certainly sufficient to have us thinking about how affordable its debt is. Importantly, Syrma SGS Technology grew its EBIT by 67% over the last twelve months, and that growth will make it easier to handle its debt. The balance sheet is clearly the area to focus on when you are analysing debt. But ultimately the future profitability of the business will decide if Syrma SGS Technology can strengthen its balance sheet over time. So if you're focused on the future you can check out this free report showing analyst profit forecasts.
But our final consideration is also important, because a company cannot pay debt with paper profits; it needs cold hard cash. So we always check how much of that EBIT is translated into free cash flow. Over the last three years, Syrma SGS Technology saw substantial negative free cash flow, in total. While investors are no doubt expecting a reversal of that situation in due course, it clearly does mean its use of debt is more risky.
Our View
Syrma SGS Technology's conversion of EBIT to free cash flow was a real negative on this analysis, although the other factors we considered were considerably better. In particular, we are dazzled with its EBIT growth rate. Considering this range of data points, we think Syrma SGS Technology is in a good position to manage its debt levels. Having said that, the load is sufficiently heavy that we would recommend any shareholders keep a close eye on it. Above most other metrics, we think its important to track how fast earnings per share is growing, if at all. If you've also come to that realization, you're in luck, because today you can view this interactive graph of Syrma SGS Technology's earnings per share history for free.
If, after all that, you're more interested in a fast growing company with a rock-solid balance sheet, then check out our list of net cash growth stocks without delay.
New: Manage All Your Stock Portfolios in One Place
We've created the ultimate portfolio companion for stock investors, and it's free.
• Connect an unlimited number of Portfolios and see your total in one currency
• Be alerted to new Warning Signs or Risks via email or mobile
• Track the Fair Value of your stocks
Have feedback on this article? Concerned about the content? Get in touch with us directly. Alternatively, email editorial-team (at) simplywallst.com.
This article by Simply Wall St is general in nature. We provide commentary based on historical data and analyst forecasts only using an unbiased methodology and our articles are not intended to be financial advice. It does not constitute a recommendation to buy or sell any stock, and does not take account of your objectives, or your financial situation. We aim to bring you long-term focused analysis driven by fundamental data. Note that our analysis may not factor in the latest price-sensitive company announcements or qualitative material. Simply Wall St has no position in any stocks mentioned.
About NSEI:SYRMA
Syrma SGS Technology
Provides turnkey electronic manufacturing services in India, the United States, Germany, and internationally.
High growth potential with excellent balance sheet.
Similar Companies
Market Insights

Advertisement
Community Narratives
MicroVision will explode future revenue by 380.37% with a vision towards success
Fair Value US$60.00|98.4% undervalued
TH
Community Contributor
The Indispensable Artery for a New North American Economy
Fair Value CA$132.87|1.3% undervalued
TI
Community Contributor