
Advertisement
- India
- /
- Communications
- /
- NSEI:SMARTLINK
Does Smartlink Holdings (NSE:SMARTLINK) Have A Healthy Balance Sheet?
Warren Buffett famously said, 'Volatility is far from synonymous with risk.' It's only natural to consider a company's balance sheet when you examine how risky it is, since debt is often involved when a business collapses. We can see that Smartlink Holdings Limited (NSE:SMARTLINK) does use debt in its business. But the more important question is: how much risk is that debt creating?
What Risk Does Debt Bring?
Debt is a tool to help businesses grow, but if a business is incapable of paying off its lenders, then it exists at their mercy. Ultimately, if the company can't fulfill its legal obligations to repay debt, shareholders could walk away with nothing. However, a more frequent (but still costly) occurrence is where a company must issue shares at bargain-basement prices, permanently diluting shareholders, just to shore up its balance sheet. Of course, debt can be an important tool in businesses, particularly capital heavy businesses. When we think about a company's use of debt, we first look at cash and debt together.
View our latest analysis for Smartlink Holdings
What Is Smartlink Holdings's Debt?
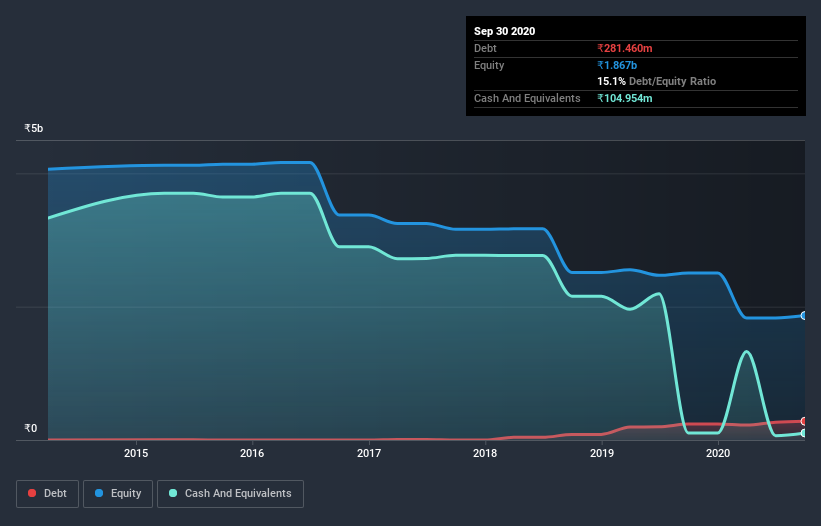
The chart below, which you can click on for greater detail, shows that Smartlink Holdings had ₹237.7m in debt in September 2020; about the same as the year before. However, because it has a cash reserve of ₹105.0m, its net debt is less, at about ₹132.8m.
How Healthy Is Smartlink Holdings's Balance Sheet?
According to the last reported balance sheet, Smartlink Holdings had liabilities of ₹396.8m due within 12 months, and liabilities of ₹77.5m due beyond 12 months. Offsetting this, it had ₹105.0m in cash and ₹84.1m in receivables that were due within 12 months. So its liabilities total ₹285.3m more than the combination of its cash and short-term receivables.
This deficit isn't so bad because Smartlink Holdings is worth ₹1.25b, and thus could probably raise enough capital to shore up its balance sheet, if the need arose. But we definitely want to keep our eyes open to indications that its debt is bringing too much risk. There's no doubt that we learn most about debt from the balance sheet. But it is Smartlink Holdings's earnings that will influence how the balance sheet holds up in the future. So if you're keen to discover more about its earnings, it might be worth checking out this graph of its long term earnings trend.
Over 12 months, Smartlink Holdings made a loss at the EBIT level, and saw its revenue drop to ₹683m, which is a fall of 31%. To be frank that doesn't bode well.
Caveat Emptor
Not only did Smartlink Holdings's revenue slip over the last twelve months, but it also produced negative earnings before interest and tax (EBIT). To be specific the EBIT loss came in at ₹7.0m. When we look at that and recall the liabilities on its balance sheet, relative to cash, it seems unwise to us for the company to have any debt. So we think its balance sheet is a little strained, though not beyond repair. For example, we would not want to see a repeat of last year's loss of ₹51m. In the meantime, we consider the stock very risky. There's no doubt that we learn most about debt from the balance sheet. However, not all investment risk resides within the balance sheet - far from it. Be aware that Smartlink Holdings is showing 3 warning signs in our investment analysis , and 1 of those is a bit unpleasant...
If, after all that, you're more interested in a fast growing company with a rock-solid balance sheet, then check out our list of net cash growth stocks without delay.
If you decide to trade Smartlink Holdings, use the lowest-cost* platform that is rated #1 Overall by Barron’s, Interactive Brokers. Trade stocks, options, futures, forex, bonds and funds on 135 markets, all from a single integrated account. Promoted
New: Manage All Your Stock Portfolios in One Place
We've created the ultimate portfolio companion for stock investors, and it's free.
• Connect an unlimited number of Portfolios and see your total in one currency
• Be alerted to new Warning Signs or Risks via email or mobile
• Track the Fair Value of your stocks
This article by Simply Wall St is general in nature. It does not constitute a recommendation to buy or sell any stock, and does not take account of your objectives, or your financial situation. We aim to bring you long-term focused analysis driven by fundamental data. Note that our analysis may not factor in the latest price-sensitive company announcements or qualitative material. Simply Wall St has no position in any stocks mentioned.
*Interactive Brokers Rated Lowest Cost Broker by StockBrokers.com Annual Online Review 2020
Have feedback on this article? Concerned about the content? Get in touch with us directly. Alternatively, email editorial-team@simplywallst.com.
About NSEI:SMARTLINK
Smartlink Holdings
Smartlink Holdings Limited, together with its subsidiaries, sources, develops, manufactures, markets, distributes, and services networking products in India and internationally.
Solid track record with excellent balance sheet.
Market Insights

Advertisement
Community Narratives
MicroVision will explode future revenue by 380.37% with a vision towards success
Fair Value US$60.00|98.5% undervalued
TH
Community Contributor
The Indispensable Artery for a New North American Economy
Fair Value CA$132.87|2.3% undervalued
TI
Community Contributor