
Advertisement
The Market Lifts 63 moons technologies limited (NSE:63MOONS) Shares 26% But It Can Do More
63 moons technologies limited (NSE:63MOONS) shares have had a really impressive month, gaining 26% after a shaky period beforehand. The last month tops off a massive increase of 168% in the last year.
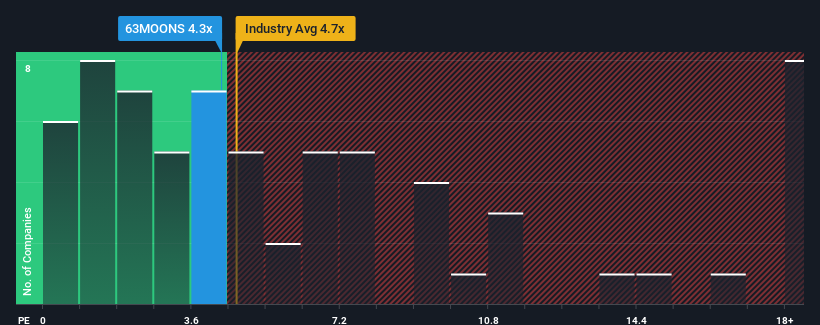
Even after such a large jump in price, there still wouldn't be many who think 63 moons technologies' price-to-sales (or "P/S") ratio of 4.3x is worth a mention when the median P/S in India's Software industry is similar at about 4.7x. However, investors might be overlooking a clear opportunity or potential setback if there is no rational basis for the P/S.
View our latest analysis for 63 moons technologies
What Does 63 moons technologies' Recent Performance Look Like?
With revenue growth that's exceedingly strong of late, 63 moons technologies has been doing very well. It might be that many expect the strong revenue performance to wane, which has kept the share price, and thus the P/S ratio, from rising. Those who are bullish on 63 moons technologies will be hoping that this isn't the case, so that they can pick up the stock at a lower valuation.
Want the full picture on earnings, revenue and cash flow for the company? Then our free report on 63 moons technologies will help you shine a light on its historical performance.How Is 63 moons technologies' Revenue Growth Trending?
63 moons technologies' P/S ratio would be typical for a company that's only expected to deliver moderate growth, and importantly, perform in line with the industry.
Taking a look back first, we see that the company grew revenue by an impressive 147% last year. The strong recent performance means it was also able to grow revenue by 243% in total over the last three years. Therefore, it's fair to say the revenue growth recently has been superb for the company.
When compared to the industry's one-year growth forecast of 18%, the most recent medium-term revenue trajectory is noticeably more alluring
With this information, we find it interesting that 63 moons technologies is trading at a fairly similar P/S compared to the industry. Apparently some shareholders believe the recent performance is at its limits and have been accepting lower selling prices.
What We Can Learn From 63 moons technologies' P/S?
63 moons technologies' stock has a lot of momentum behind it lately, which has brought its P/S level with the rest of the industry. Using the price-to-sales ratio alone to determine if you should sell your stock isn't sensible, however it can be a practical guide to the company's future prospects.
We didn't quite envision 63 moons technologies' P/S sitting in line with the wider industry, considering the revenue growth over the last three-year is higher than the current industry outlook. It'd be fair to assume that potential risks the company faces could be the contributing factor to the lower than expected P/S. While recent revenue trends over the past medium-term suggest that the risk of a price decline is low, investors appear to see the likelihood of revenue fluctuations in the future.
Don't forget that there may be other risks. For instance, we've identified 2 warning signs for 63 moons technologies that you should be aware of.
If companies with solid past earnings growth is up your alley, you may wish to see this free collection of other companies with strong earnings growth and low P/E ratios.
Valuation is complex, but we're here to simplify it.
Discover if 63 moons technologies might be undervalued or overvalued with our detailed analysis, featuring fair value estimates, potential risks, dividends, insider trades, and its financial condition.
Access Free AnalysisHave feedback on this article? Concerned about the content? Get in touch with us directly. Alternatively, email editorial-team (at) simplywallst.com.
This article by Simply Wall St is general in nature. We provide commentary based on historical data and analyst forecasts only using an unbiased methodology and our articles are not intended to be financial advice. It does not constitute a recommendation to buy or sell any stock, and does not take account of your objectives, or your financial situation. We aim to bring you long-term focused analysis driven by fundamental data. Note that our analysis may not factor in the latest price-sensitive company announcements or qualitative material. Simply Wall St has no position in any stocks mentioned.
About NSEI:63MOONS
63 moons technologies
Provides software solutions in India and internationally.
Mediocre balance sheet with weak fundamentals.
Similar Companies
Market Insights

Advertisement
Community Narratives
MicroVision will explode future revenue by 380.37% with a vision towards success
Fair Value US$60.00|98.4% undervalued
TH
Community Contributor
The Indispensable Artery for a New North American Economy
Fair Value CA$132.87|1.1% undervalued
TI
Community Contributor