Stock Analysis
- India
- /
- Specialty Stores
- /
- NSEI:TRENT
There Are Reasons To Feel Uneasy About Trent's (NSE:TRENT) Returns On Capital


Did you know there are some financial metrics that can provide clues of a potential multi-bagger? Typically, we'll want to notice a trend of growing return on capital employed (ROCE) and alongside that, an expanding base of capital employed. If you see this, it typically means it's a company with a great business model and plenty of profitable reinvestment opportunities. Having said that, from a first glance at Trent (NSE:TRENT) we aren't jumping out of our chairs at how returns are trending, but let's have a deeper look.
What is Return On Capital Employed (ROCE)?
If you haven't worked with ROCE before, it measures the 'return' (pre-tax profit) a company generates from capital employed in its business. Analysts use this formula to calculate it for Trent:
Return on Capital Employed = Earnings Before Interest and Tax (EBIT) ÷ (Total Assets - Current Liabilities)
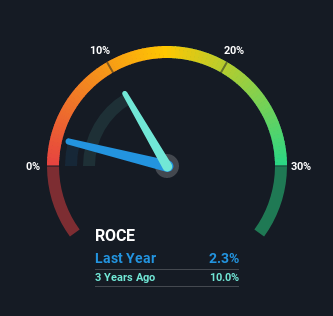
0.023 = ₹1.2b ÷ (₹57b - ₹7.5b) (Based on the trailing twelve months to March 2021).
Therefore, Trent has an ROCE of 2.3%. In absolute terms, that's a low return and it also under-performs the Multiline Retail industry average of 5.6%.
View our latest analysis for Trent
In the above chart we have measured Trent's prior ROCE against its prior performance, but the future is arguably more important. If you're interested, you can view the analysts predictions in our free report on analyst forecasts for the company.
The Trend Of ROCE
In terms of Trent's historical ROCE movements, the trend isn't fantastic. Over the last five years, returns on capital have decreased to 2.3% from 3.7% five years ago. Given the business is employing more capital while revenue has slipped, this is a bit concerning. This could mean that the business is losing its competitive advantage or market share, because while more money is being put into ventures, it's actually producing a lower return - "less bang for their buck" per se.
On a side note, Trent has done well to pay down its current liabilities to 13% of total assets. That could partly explain why the ROCE has dropped. What's more, this can reduce some aspects of risk to the business because now the company's suppliers or short-term creditors are funding less of its operations. Some would claim this reduces the business' efficiency at generating ROCE since it is now funding more of the operations with its own money.
Our Take On Trent's ROCE
We're a bit apprehensive about Trent because despite more capital being deployed in the business, returns on that capital and sales have both fallen. Since the stock has skyrocketed 412% over the last five years, it looks like investors have high expectations of the stock. In any case, the current underlying trends don't bode well for long term performance so unless they reverse, we'd start looking elsewhere.
Trent could be trading at an attractive price in other respects, so you might find our free intrinsic value estimation on our platform quite valuable.
While Trent may not currently earn the highest returns, we've compiled a list of companies that currently earn more than 25% return on equity. Check out this free list here.
When trading Trent or any other investment, use the platform considered by many to be the Professional's Gateway to the Worlds Market, Interactive Brokers. You get the lowest-cost* trading on stocks, options, futures, forex, bonds and funds worldwide from a single integrated account. Promoted
Valuation is complex, but we're helping make it simple.
Find out whether Trent is potentially over or undervalued by checking out our comprehensive analysis, which includes fair value estimates, risks and warnings, dividends, insider transactions and financial health.
View the Free AnalysisThis article by Simply Wall St is general in nature. It does not constitute a recommendation to buy or sell any stock, and does not take account of your objectives, or your financial situation. We aim to bring you long-term focused analysis driven by fundamental data. Note that our analysis may not factor in the latest price-sensitive company announcements or qualitative material. Simply Wall St has no position in any stocks mentioned.
*Interactive Brokers Rated Lowest Cost Broker by StockBrokers.com Annual Online Review 2020
Have feedback on this article? Concerned about the content? Get in touch with us directly. Alternatively, email editorial-team (at) simplywallst.com.
About NSEI:TRENT
Trent
Engages in the retailing and trading of apparels, footwear, accessories, toys, games, and other products in India.
Flawless balance sheet with solid track record.
