
Advertisement
- India
- /
- Specialty Stores
- /
- NSEI:KHADIM
Khadim India (NSE:KHADIM) Is Doing The Right Things To Multiply Its Share Price
If you're looking for a multi-bagger, there's a few things to keep an eye out for. In a perfect world, we'd like to see a company investing more capital into its business and ideally the returns earned from that capital are also increasing. Basically this means that a company has profitable initiatives that it can continue to reinvest in, which is a trait of a compounding machine. With that in mind, we've noticed some promising trends at Khadim India (NSE:KHADIM) so let's look a bit deeper.
Return On Capital Employed (ROCE): What Is It?
Just to clarify if you're unsure, ROCE is a metric for evaluating how much pre-tax income (in percentage terms) a company earns on the capital invested in its business. To calculate this metric for Khadim India, this is the formula:
Return on Capital Employed = Earnings Before Interest and Tax (EBIT) ÷ (Total Assets - Current Liabilities)
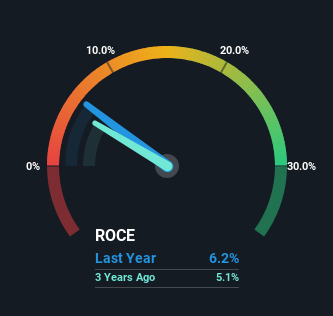
0.062 = ₹269m ÷ (₹8.2b - ₹3.9b) (Based on the trailing twelve months to December 2024).
So, Khadim India has an ROCE of 6.2%. In absolute terms, that's a low return and it also under-performs the Specialty Retail industry average of 16%.
See our latest analysis for Khadim India
While the past is not representative of the future, it can be helpful to know how a company has performed historically, which is why we have this chart above. If you want to delve into the historical earnings , check out these free graphs detailing revenue and cash flow performance of Khadim India.
What The Trend Of ROCE Can Tell Us
Khadim India's ROCE growth is quite impressive. More specifically, while the company has kept capital employed relatively flat over the last five years, the ROCE has climbed 105% in that same time. Basically the business is generating higher returns from the same amount of capital and that is proof that there are improvements in the company's efficiencies. The company is doing well in that sense, and it's worth investigating what the management team has planned for long term growth prospects.
Another thing to note, Khadim India has a high ratio of current liabilities to total assets of 47%. This effectively means that suppliers (or short-term creditors) are funding a large portion of the business, so just be aware that this can introduce some elements of risk. While it's not necessarily a bad thing, it can be beneficial if this ratio is lower.
The Bottom Line
As discussed above, Khadim India appears to be getting more proficient at generating returns since capital employed has remained flat but earnings (before interest and tax) are up. And with the stock having performed exceptionally well over the last five years, these patterns are being accounted for by investors. Therefore, we think it would be worth your time to check if these trends are going to continue.
One more thing: We've identified 3 warning signs with Khadim India (at least 1 which is significant) , and understanding these would certainly be useful.
For those who like to invest in solid companies, check out this free list of companies with solid balance sheets and high returns on equity.
Valuation is complex, but we're here to simplify it.
Discover if Khadim India might be undervalued or overvalued with our detailed analysis, featuring fair value estimates, potential risks, dividends, insider trades, and its financial condition.
Access Free AnalysisHave feedback on this article? Concerned about the content? Get in touch with us directly. Alternatively, email editorial-team (at) simplywallst.com.
This article by Simply Wall St is general in nature. We provide commentary based on historical data and analyst forecasts only using an unbiased methodology and our articles are not intended to be financial advice. It does not constitute a recommendation to buy or sell any stock, and does not take account of your objectives, or your financial situation. We aim to bring you long-term focused analysis driven by fundamental data. Note that our analysis may not factor in the latest price-sensitive company announcements or qualitative material. Simply Wall St has no position in any stocks mentioned.
About NSEI:KHADIM
Solid track record with mediocre balance sheet.
Similar Companies
Market Insights

Advertisement
Community Narratives
MicroVision will explode future revenue by 380.37% with a vision towards success
Fair Value US$60.00|98.5% undervalued
TH
Community Contributor
The Indispensable Artery for a New North American Economy
Fair Value CA$132.87|2.3% undervalued
TI
Community Contributor