
Advertisement
- India
- /
- Real Estate
- /
- NSEI:SOBHA
Insiders the biggest winners as Sobha Limited's (NSE:SOBHA) market cap rises to ₹177b
Key Insights
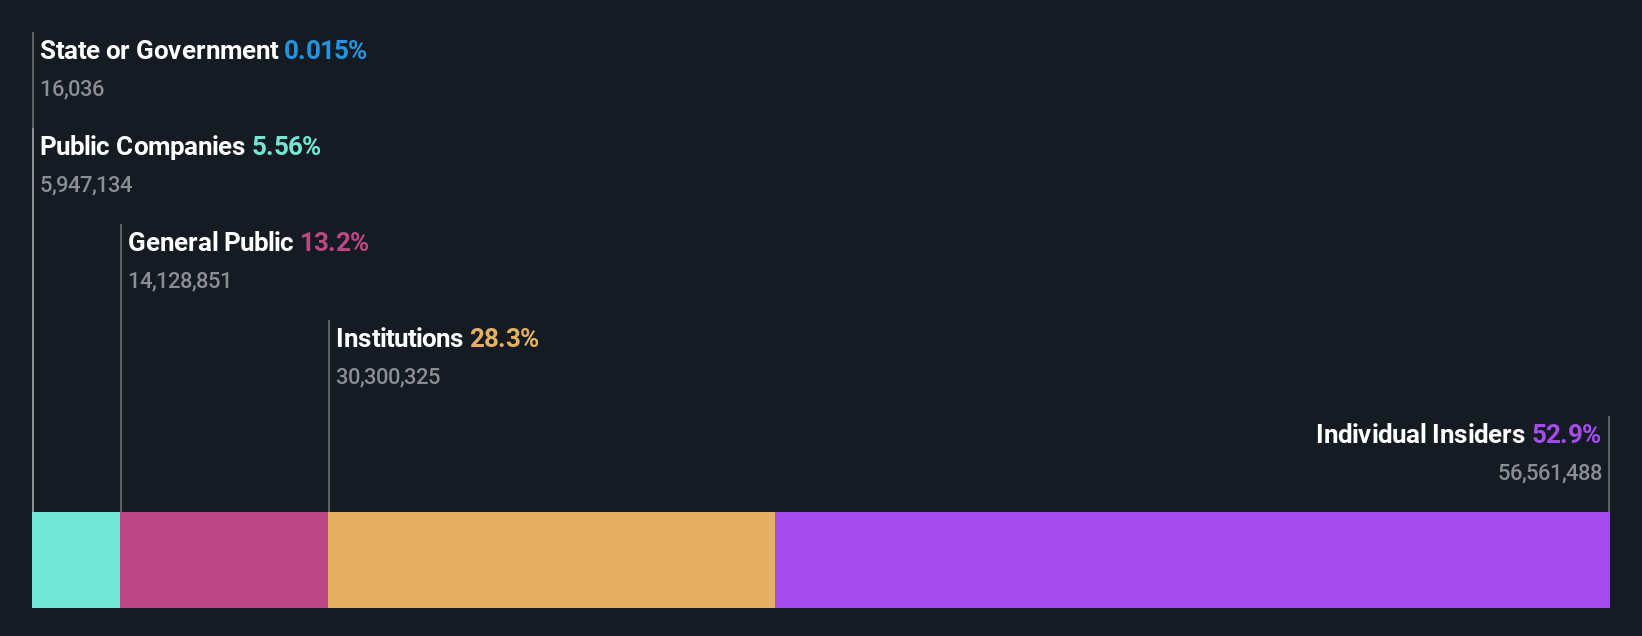
- Insiders appear to have a vested interest in Sobha's growth, as seen by their sizeable ownership
- 55% of the business is held by the top 3 shareholders
- Institutional ownership in Sobha is 28%
A look at the shareholders of Sobha Limited (NSE:SOBHA) can tell us which group is most powerful. The group holding the most number of shares in the company, around 53% to be precise, is individual insiders. Put another way, the group faces the maximum upside potential (or downside risk).
As a result, insiders were the biggest beneficiaries of last week’s 5.6% gain.
Let's take a closer look to see what the different types of shareholders can tell us about Sobha.
View our latest analysis for Sobha
What Does The Institutional Ownership Tell Us About Sobha?
Institutional investors commonly compare their own returns to the returns of a commonly followed index. So they generally do consider buying larger companies that are included in the relevant benchmark index.
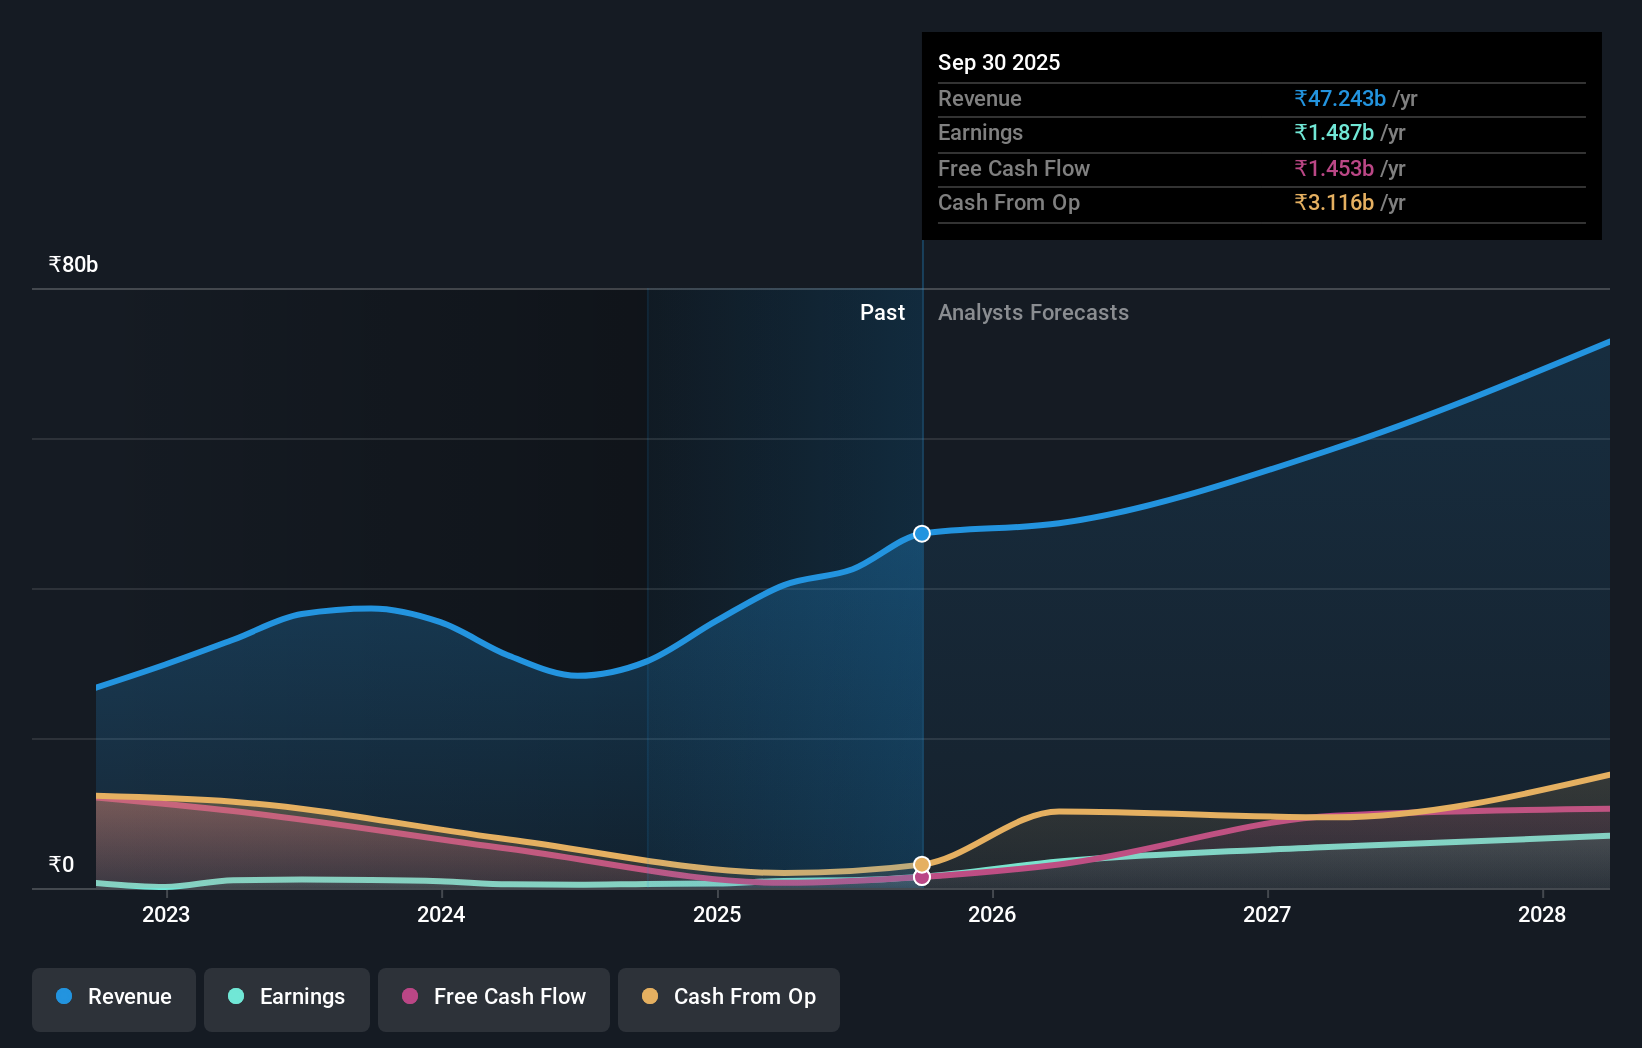
We can see that Sobha does have institutional investors; and they hold a good portion of the company's stock. This can indicate that the company has a certain degree of credibility in the investment community. However, it is best to be wary of relying on the supposed validation that comes with institutional investors. They too, get it wrong sometimes. When multiple institutions own a stock, there's always a risk that they are in a 'crowded trade'. When such a trade goes wrong, multiple parties may compete to sell stock fast. This risk is higher in a company without a history of growth. You can see Sobha's historic earnings and revenue below, but keep in mind there's always more to the story.
We note that hedge funds don't have a meaningful investment in Sobha. Sobha Menon is currently the company's largest shareholder with 31% of shares outstanding. For context, the second largest shareholder holds about 19% of the shares outstanding, followed by an ownership of 5.6% by the third-largest shareholder. P. N. Menon, who is the second-largest shareholder, also happens to hold the title of Top Key Executive.
To make our study more interesting, we found that the top 3 shareholders have a majority ownership in the company, meaning that they are powerful enough to influence the decisions of the company.
Researching institutional ownership is a good way to gauge and filter a stock's expected performance. The same can be achieved by studying analyst sentiments. There are plenty of analysts covering the stock, so it might be worth seeing what they are forecasting, too.
Insider Ownership Of Sobha
The definition of an insider can differ slightly between different countries, but members of the board of directors always count. Company management run the business, but the CEO will answer to the board, even if he or she is a member of it.
I generally consider insider ownership to be a good thing. However, on some occasions it makes it more difficult for other shareholders to hold the board accountable for decisions.
Our information suggests that insiders own more than half of Sobha Limited. This gives them effective control of the company. Insiders own ₹94b worth of shares in the ₹177b company. That's extraordinary! Most would be pleased to see the board is investing alongside them. You may wish to discover if they have been buying or selling.
General Public Ownership
The general public-- including retail investors -- own 13% stake in the company, and hence can't easily be ignored. This size of ownership, while considerable, may not be enough to change company policy if the decision is not in sync with other large shareholders.
Public Company Ownership
We can see that public companies hold 5.6% of the Sobha shares on issue. We can't be certain but it is quite possible this is a strategic stake. The businesses may be similar, or work together.
Next Steps:
I find it very interesting to look at who exactly owns a company. But to truly gain insight, we need to consider other information, too.
I always like to check for a history of revenue growth. You can too, by accessing this free chart of historic revenue and earnings in this detailed graph.
Ultimately the future is most important. You can access this free report on analyst forecasts for the company.
NB: Figures in this article are calculated using data from the last twelve months, which refer to the 12-month period ending on the last date of the month the financial statement is dated. This may not be consistent with full year annual report figures.
New: Manage All Your Stock Portfolios in One Place
We've created the ultimate portfolio companion for stock investors, and it's free.
• Connect an unlimited number of Portfolios and see your total in one currency
• Be alerted to new Warning Signs or Risks via email or mobile
• Track the Fair Value of your stocks
Have feedback on this article? Concerned about the content? Get in touch with us directly. Alternatively, email editorial-team (at) simplywallst.com.
This article by Simply Wall St is general in nature. We provide commentary based on historical data and analyst forecasts only using an unbiased methodology and our articles are not intended to be financial advice. It does not constitute a recommendation to buy or sell any stock, and does not take account of your objectives, or your financial situation. We aim to bring you long-term focused analysis driven by fundamental data. Note that our analysis may not factor in the latest price-sensitive company announcements or qualitative material. Simply Wall St has no position in any stocks mentioned.
About NSEI:SOBHA
Sobha
Engages in the construction, development, sale, management, and operation of residential and commercial real estate under the Sobha brand primarily in India.
Flawless balance sheet with reasonable growth potential.
Similar Companies
Market Insights

Advertisement
Community Narratives
The company that turned a verb into a global necessity and basically runs the modern internet, digital ads, smartphones, maps, and AI.
Fair Value US$300.00|5.4% undervalued
OS
Community Contributor
Flowers Foods Pays A Fair Price For Health
Fair Value US$16.12|26.3% undervalued
NV
Community Contributor
TMX Group will thrive with 33.3% profit margin and enduring market moat
Fair Value CA$49.90|4.1% overvalued
LI
Community Contributor
The "Molecular Pencil": Why Beam's Technology is Built to Win
Fair Value US$65.01|62.7% undervalued
DA
Community Contributor