
Advertisement
Lacklustre Performance Is Driving Mangalam Drugs & Organics Limited's (NSE:MANGALAM) 31% Price Drop
Unfortunately for some shareholders, the Mangalam Drugs & Organics Limited (NSE:MANGALAM) share price has dived 31% in the last thirty days, prolonging recent pain. The recent drop completes a disastrous twelve months for shareholders, who are sitting on a 53% loss during that time.
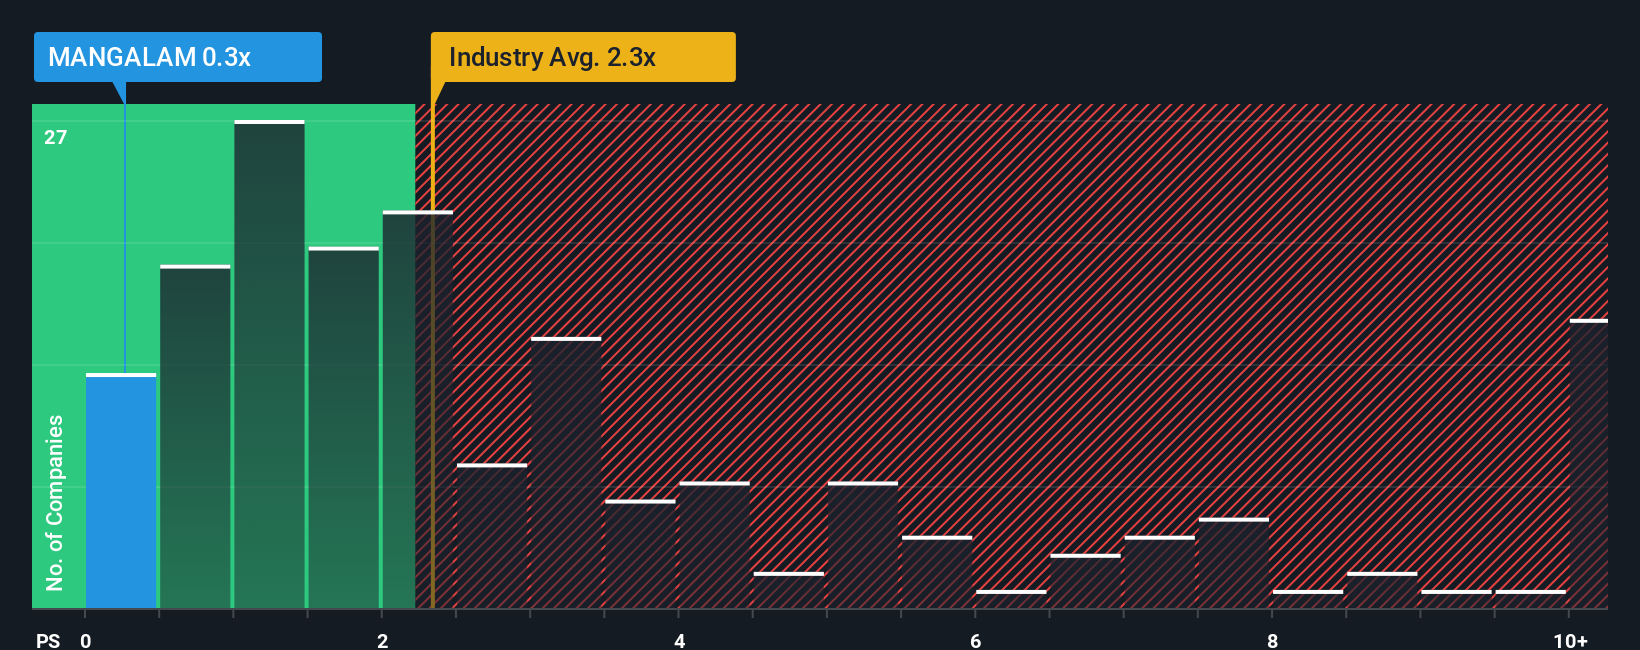
Since its price has dipped substantially, Mangalam Drugs & Organics may look like a strong buying opportunity at present with its price-to-sales (or "P/S") ratio of 0.3x, considering almost half of all companies in the Pharmaceuticals industry in India have P/S ratios greater than 2.3x and even P/S higher than 5x aren't out of the ordinary. However, the P/S might be quite low for a reason and it requires further investigation to determine if it's justified.
View our latest analysis for Mangalam Drugs & Organics
How Mangalam Drugs & Organics Has Been Performing
As an illustration, revenue has deteriorated at Mangalam Drugs & Organics over the last year, which is not ideal at all. One possibility is that the P/S is low because investors think the company won't do enough to avoid underperforming the broader industry in the near future. However, if this doesn't eventuate then existing shareholders may be feeling optimistic about the future direction of the share price.
Want the full picture on earnings, revenue and cash flow for the company? Then our free report on Mangalam Drugs & Organics will help you shine a light on its historical performance.Do Revenue Forecasts Match The Low P/S Ratio?
There's an inherent assumption that a company should far underperform the industry for P/S ratios like Mangalam Drugs & Organics' to be considered reasonable.
Taking a look back first, the company's revenue growth last year wasn't something to get excited about as it posted a disappointing decline of 16%. This means it has also seen a slide in revenue over the longer-term as revenue is down 34% in total over the last three years. Accordingly, shareholders would have felt downbeat about the medium-term rates of revenue growth.
In contrast to the company, the rest of the industry is expected to grow by 12% over the next year, which really puts the company's recent medium-term revenue decline into perspective.
In light of this, it's understandable that Mangalam Drugs & Organics' P/S would sit below the majority of other companies. However, we think shrinking revenues are unlikely to lead to a stable P/S over the longer term, which could set up shareholders for future disappointment. Even just maintaining these prices could be difficult to achieve as recent revenue trends are already weighing down the shares.
What We Can Learn From Mangalam Drugs & Organics' P/S?
Shares in Mangalam Drugs & Organics have plummeted and its P/S has followed suit. Typically, we'd caution against reading too much into price-to-sales ratios when settling on investment decisions, though it can reveal plenty about what other market participants think about the company.
Our examination of Mangalam Drugs & Organics confirms that the company's shrinking revenue over the past medium-term is a key factor in its low price-to-sales ratio, given the industry is projected to grow. Right now shareholders are accepting the low P/S as they concede future revenue probably won't provide any pleasant surprises either. Unless the recent medium-term conditions improve, they will continue to form a barrier for the share price around these levels.
Before you settle on your opinion, we've discovered 3 warning signs for Mangalam Drugs & Organics that you should be aware of.
If companies with solid past earnings growth is up your alley, you may wish to see this free collection of other companies with strong earnings growth and low P/E ratios.
New: Manage All Your Stock Portfolios in One Place
We've created the ultimate portfolio companion for stock investors, and it's free.
• Connect an unlimited number of Portfolios and see your total in one currency
• Be alerted to new Warning Signs or Risks via email or mobile
• Track the Fair Value of your stocks
Have feedback on this article? Concerned about the content? Get in touch with us directly. Alternatively, email editorial-team (at) simplywallst.com.
This article by Simply Wall St is general in nature. We provide commentary based on historical data and analyst forecasts only using an unbiased methodology and our articles are not intended to be financial advice. It does not constitute a recommendation to buy or sell any stock, and does not take account of your objectives, or your financial situation. We aim to bring you long-term focused analysis driven by fundamental data. Note that our analysis may not factor in the latest price-sensitive company announcements or qualitative material. Simply Wall St has no position in any stocks mentioned.
About NSEI:MANGALAM
Mangalam Drugs & Organics
Together with its subsidiary, manufactures and sells active pharmaceutical ingredients (APIs) and intermediates in India.
Good value with mediocre balance sheet.
Market Insights

Advertisement
Community Narratives
MicroVision will explode future revenue by 380.37% with a vision towards success
Fair Value US$60.00|98.5% undervalued
TH
Community Contributor
The Indispensable Artery for a New North American Economy
Fair Value CA$132.87|2.3% undervalued
TI
Community Contributor