Stock Analysis

We think all investors should try to buy and hold high quality multi-year winners. And we've seen some truly amazing gains over the years. To wit, the J. B. Chemicals & Pharmaceuticals Limited (NSE:JBCHEPHARM) share price has soared 848% over five years. And this is just one example of the epic gains achieved by some long term investors. We note the stock price is up 1.9% in the last seven days. It really delights us to see such great share price performance for investors.
So let's investigate and see if the longer term performance of the company has been in line with the underlying business' progress.
See our latest analysis for J. B. Chemicals & Pharmaceuticals
While markets are a powerful pricing mechanism, share prices reflect investor sentiment, not just underlying business performance. One flawed but reasonable way to assess how sentiment around a company has changed is to compare the earnings per share (EPS) with the share price.
Over half a decade, J. B. Chemicals & Pharmaceuticals managed to grow its earnings per share at 23% a year. This EPS growth is slower than the share price growth of 57% per year, over the same period. This suggests that market participants hold the company in higher regard, these days. And that's hardly shocking given the track record of growth. This favorable sentiment is reflected in its (fairly optimistic) P/E ratio of 49.79.
You can see below how EPS has changed over time (discover the exact values by clicking on the image).
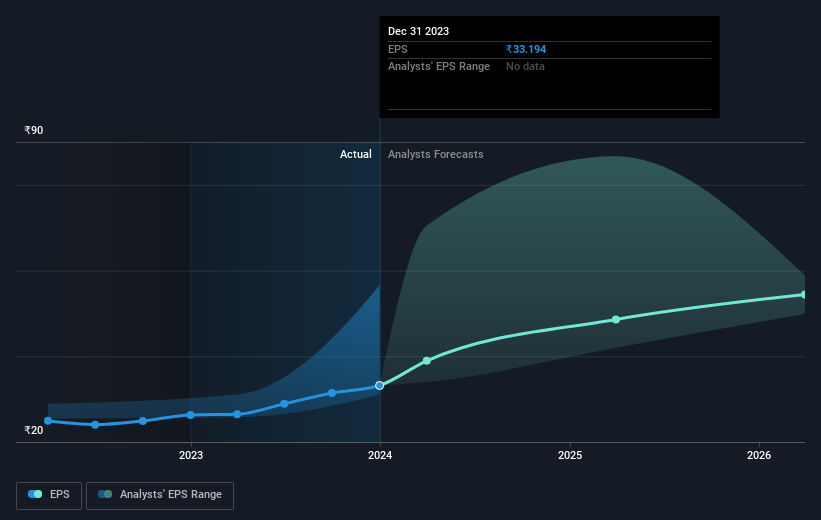
We know that J. B. Chemicals & Pharmaceuticals has improved its bottom line lately, but is it going to grow revenue? This free report showing analyst revenue forecasts should help you figure out if the EPS growth can be sustained.
What About Dividends?
It is important to consider the total shareholder return, as well as the share price return, for any given stock. Whereas the share price return only reflects the change in the share price, the TSR includes the value of dividends (assuming they were reinvested) and the benefit of any discounted capital raising or spin-off. So for companies that pay a generous dividend, the TSR is often a lot higher than the share price return. In the case of J. B. Chemicals & Pharmaceuticals, it has a TSR of 913% for the last 5 years. That exceeds its share price return that we previously mentioned. This is largely a result of its dividend payments!
A Different Perspective
We're pleased to report that J. B. Chemicals & Pharmaceuticals shareholders have received a total shareholder return of 70% over one year. That's including the dividend. Since the one-year TSR is better than the five-year TSR (the latter coming in at 59% per year), it would seem that the stock's performance has improved in recent times. In the best case scenario, this may hint at some real business momentum, implying that now could be a great time to delve deeper. I find it very interesting to look at share price over the long term as a proxy for business performance. But to truly gain insight, we need to consider other information, too. For example, we've discovered 2 warning signs for J. B. Chemicals & Pharmaceuticals that you should be aware of before investing here.
For those who like to find winning investments this free list of growing companies with recent insider purchasing, could be just the ticket.
Please note, the market returns quoted in this article reflect the market weighted average returns of stocks that currently trade on Indian exchanges.
Valuation is complex, but we're helping make it simple.
Find out whether J. B. Chemicals & Pharmaceuticals is potentially over or undervalued by checking out our comprehensive analysis, which includes fair value estimates, risks and warnings, dividends, insider transactions and financial health.
View the Free AnalysisHave feedback on this article? Concerned about the content? Get in touch with us directly. Alternatively, email editorial-team (at) simplywallst.com.
This article by Simply Wall St is general in nature. We provide commentary based on historical data and analyst forecasts only using an unbiased methodology and our articles are not intended to be financial advice. It does not constitute a recommendation to buy or sell any stock, and does not take account of your objectives, or your financial situation. We aim to bring you long-term focused analysis driven by fundamental data. Note that our analysis may not factor in the latest price-sensitive company announcements or qualitative material. Simply Wall St has no position in any stocks mentioned.
About NSEI:JBCHEPHARM
J. B. Chemicals & Pharmaceuticals
J. B. Chemicals & Pharmaceuticals Limited manufactures and markets pharmaceutical formulations, herbal remedies, and active pharmaceutical ingredients (API) in India and internationally.
High growth potential with solid track record and pays a dividend.

