Stock Analysis
Dr. Reddy's Laboratories (NSE:DRREDDY) stock performs better than its underlying earnings growth over last five years


When you buy a stock there is always a possibility that it could drop 100%. But on the bright side, you can make far more than 100% on a really good stock. Long term Dr. Reddy's Laboratories Limited (NSE:DRREDDY) shareholders would be well aware of this, since the stock is up 138% in five years. It's even up 4.1% in the last week. But this could be related to the buoyant market which is up about 8.0% in a week.
After a strong gain in the past week, it's worth seeing if longer term returns have been driven by improving fundamentals.
Check out our latest analysis for Dr. Reddy's Laboratories
To quote Buffett, 'Ships will sail around the world but the Flat Earth Society will flourish. There will continue to be wide discrepancies between price and value in the marketplace...' One imperfect but simple way to consider how the market perception of a company has shifted is to compare the change in the earnings per share (EPS) with the share price movement.
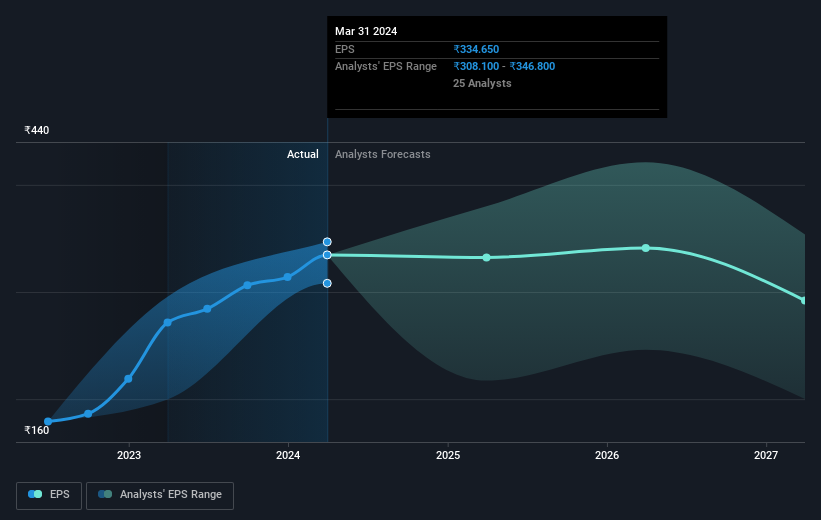
Over half a decade, Dr. Reddy's Laboratories managed to grow its earnings per share at 24% a year. This EPS growth is higher than the 19% average annual increase in the share price. So one could conclude that the broader market has become more cautious towards the stock.
You can see how EPS has changed over time in the image below (click on the chart to see the exact values).
We know that Dr. Reddy's Laboratories has improved its bottom line over the last three years, but what does the future have in store? This free interactive report on Dr. Reddy's Laboratories' balance sheet strength is a great place to start, if you want to investigate the stock further.
What About Dividends?
As well as measuring the share price return, investors should also consider the total shareholder return (TSR). Whereas the share price return only reflects the change in the share price, the TSR includes the value of dividends (assuming they were reinvested) and the benefit of any discounted capital raising or spin-off. So for companies that pay a generous dividend, the TSR is often a lot higher than the share price return. As it happens, Dr. Reddy's Laboratories' TSR for the last 5 years was 146%, which exceeds the share price return mentioned earlier. And there's no prize for guessing that the dividend payments largely explain the divergence!
A Different Perspective
Dr. Reddy's Laboratories shareholders gained a total return of 30% during the year. But that return falls short of the market. The silver lining is that the gain was actually better than the average annual return of 20% per year over five year. This suggests the company might be improving over time. While it is well worth considering the different impacts that market conditions can have on the share price, there are other factors that are even more important. Even so, be aware that Dr. Reddy's Laboratories is showing 1 warning sign in our investment analysis , you should know about...
If you would prefer to check out another company -- one with potentially superior financials -- then do not miss this free list of companies that have proven they can grow earnings.
Please note, the market returns quoted in this article reflect the market weighted average returns of stocks that currently trade on Indian exchanges.
Valuation is complex, but we're helping make it simple.
Find out whether Dr. Reddy's Laboratories is potentially over or undervalued by checking out our comprehensive analysis, which includes fair value estimates, risks and warnings, dividends, insider transactions and financial health.
View the Free AnalysisHave feedback on this article? Concerned about the content? Get in touch with us directly. Alternatively, email editorial-team (at) simplywallst.com.
This article by Simply Wall St is general in nature. We provide commentary based on historical data and analyst forecasts only using an unbiased methodology and our articles are not intended to be financial advice. It does not constitute a recommendation to buy or sell any stock, and does not take account of your objectives, or your financial situation. We aim to bring you long-term focused analysis driven by fundamental data. Note that our analysis may not factor in the latest price-sensitive company announcements or qualitative material. Simply Wall St has no position in any stocks mentioned.
About NSEI:DRREDDY
Dr. Reddy's Laboratories
Operates as an integrated pharmaceutical company worldwide.
Flawless balance sheet established dividend payer.
