

Many investors are still learning about the various metrics that can be useful when analysing a stock. This article is for those who would like to learn about Return On Equity (ROE). We'll use ROE to examine Vedanta Limited (NSE:VEDL), by way of a worked example.
Return on equity or ROE is a key measure used to assess how efficiently a company's management is utilizing the company's capital. Simply put, it is used to assess the profitability of a company in relation to its equity capital.
Check out our latest analysis for Vedanta
How Do You Calculate Return On Equity?
ROE can be calculated by using the formula:
Return on Equity = Net Profit (from continuing operations) ÷ Shareholders' Equity
So, based on the above formula, the ROE for Vedanta is:
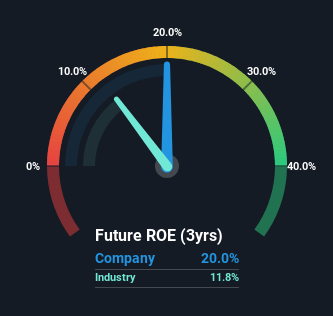
20% = ₹84b ÷ ₹420b (Based on the trailing twelve months to December 2023).
The 'return' refers to a company's earnings over the last year. Another way to think of that is that for every ₹1 worth of equity, the company was able to earn ₹0.20 in profit.
Does Vedanta Have A Good ROE?
By comparing a company's ROE with its industry average, we can get a quick measure of how good it is. The limitation of this approach is that some companies are quite different from others, even within the same industry classification. Pleasingly, Vedanta has a superior ROE than the average (12%) in the Metals and Mining industry.
That's clearly a positive. With that said, a high ROE doesn't always indicate high profitability. A higher proportion of debt in a company's capital structure may also result in a high ROE, where the high debt levels could be a huge risk . Our risks dashboardshould have the 3 risks we have identified for Vedanta.
How Does Debt Impact Return On Equity?
Virtually all companies need money to invest in the business, to grow profits. The cash for investment can come from prior year profits (retained earnings), issuing new shares, or borrowing. In the first two cases, the ROE will capture this use of capital to grow. In the latter case, the debt used for growth will improve returns, but won't affect the total equity. That will make the ROE look better than if no debt was used.
Combining Vedanta's Debt And Its 20% Return On Equity
It's worth noting the high use of debt by Vedanta, leading to its debt to equity ratio of 1.77. While its ROE is respectable, it is worth keeping in mind that there is usually a limit as to how much debt a company can use. Investors should think carefully about how a company might perform if it was unable to borrow so easily, because credit markets do change over time.
Conclusion
Return on equity is one way we can compare its business quality of different companies. In our books, the highest quality companies have high return on equity, despite low debt. If two companies have the same ROE, then I would generally prefer the one with less debt.
But ROE is just one piece of a bigger puzzle, since high quality businesses often trade on high multiples of earnings. Profit growth rates, versus the expectations reflected in the price of the stock, are a particularly important to consider. So you might want to take a peek at this data-rich interactive graph of forecasts for the company.
Of course Vedanta may not be the best stock to buy. So you may wish to see this free collection of other companies that have high ROE and low debt.
New: Manage All Your Stock Portfolios in One Place
We've created the ultimate portfolio companion for stock investors, and it's free.
• Connect an unlimited number of Portfolios and see your total in one currency
• Be alerted to new Warning Signs or Risks via email or mobile
• Track the Fair Value of your stocks
Have feedback on this article? Concerned about the content? Get in touch with us directly. Alternatively, email editorial-team (at) simplywallst.com.
This article by Simply Wall St is general in nature. We provide commentary based on historical data and analyst forecasts only using an unbiased methodology and our articles are not intended to be financial advice. It does not constitute a recommendation to buy or sell any stock, and does not take account of your objectives, or your financial situation. We aim to bring you long-term focused analysis driven by fundamental data. Note that our analysis may not factor in the latest price-sensitive company announcements or qualitative material. Simply Wall St has no position in any stocks mentioned.
About NSEI:VEDL
Vedanta
A diversified natural resources company, explores, extracts, and processes minerals, and oil and gas in India, Europe, China, the United States, Mexico, and internationally.
Reasonable growth potential average dividend payer.
