
Advertisement
Some May Be Optimistic About Tamilnadu Petroproducts' (NSE:TNPETRO) Earnings
Tamilnadu Petroproducts Limited's (NSE:TNPETRO) recent soft profit numbers didn't appear to worry shareholders, as the stock price showed strength. We think that investors might be looking at some positive factors beyond the earnings numbers.
See our latest analysis for Tamilnadu Petroproducts
Examining Cashflow Against Tamilnadu Petroproducts' Earnings
As finance nerds would already know, the accrual ratio from cashflow is a key measure for assessing how well a company's free cash flow (FCF) matches its profit. The accrual ratio subtracts the FCF from the profit for a given period, and divides the result by the average operating assets of the company over that time. This ratio tells us how much of a company's profit is not backed by free cashflow.
Therefore, it's actually considered a good thing when a company has a negative accrual ratio, but a bad thing if its accrual ratio is positive. That is not intended to imply we should worry about a positive accrual ratio, but it's worth noting where the accrual ratio is rather high. That's because some academic studies have suggested that high accruals ratios tend to lead to lower profit or less profit growth.
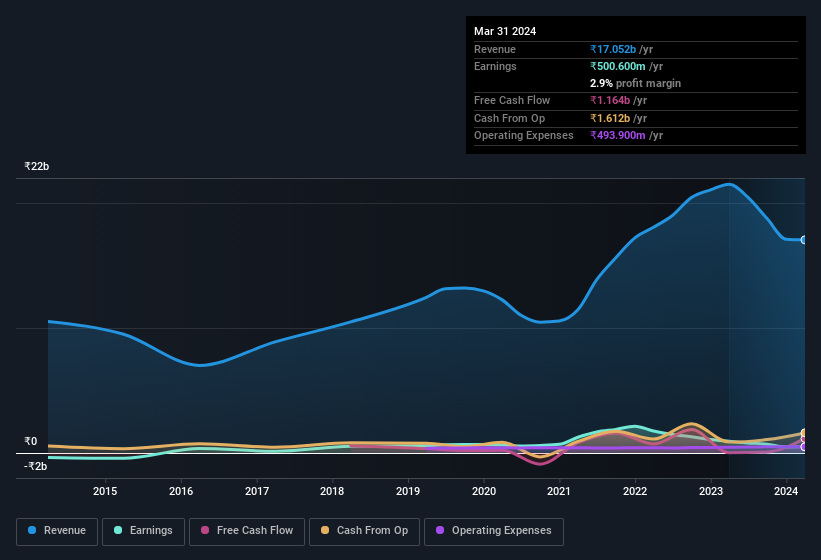
Tamilnadu Petroproducts has an accrual ratio of -0.13 for the year to March 2024. Therefore, its statutory earnings were quite a lot less than its free cashflow. Indeed, in the last twelve months it reported free cash flow of ₹1.2b, well over the ₹500.6m it reported in profit. Tamilnadu Petroproducts' free cash flow improved over the last year, which is generally good to see. However, that's not all there is to consider. We can see that unusual items have impacted its statutory profit, and therefore the accrual ratio.
Note: we always recommend investors check balance sheet strength. Click here to be taken to our balance sheet analysis of Tamilnadu Petroproducts.
How Do Unusual Items Influence Profit?
Tamilnadu Petroproducts' profit was reduced by unusual items worth ₹140m in the last twelve months, and this helped it produce high cash conversion, as reflected by its unusual items. This is what you'd expect to see where a company has a non-cash charge reducing paper profits. It's never great to see unusual items costing the company profits, but on the upside, things might improve sooner rather than later. When we analysed the vast majority of listed companies worldwide, we found that significant unusual items are often not repeated. And that's hardly a surprise given these line items are considered unusual. Assuming those unusual expenses don't come up again, we'd therefore expect Tamilnadu Petroproducts to produce a higher profit next year, all else being equal.
Our Take On Tamilnadu Petroproducts' Profit Performance
Considering both Tamilnadu Petroproducts' accrual ratio and its unusual items, we think its statutory earnings are unlikely to exaggerate the company's underlying earnings power. Looking at all these factors, we'd say that Tamilnadu Petroproducts' underlying earnings power is at least as good as the statutory numbers would make it seem. If you want to do dive deeper into Tamilnadu Petroproducts, you'd also look into what risks it is currently facing. Every company has risks, and we've spotted 3 warning signs for Tamilnadu Petroproducts you should know about.
Our examination of Tamilnadu Petroproducts has focussed on certain factors that can make its earnings look better than they are. And it has passed with flying colours. But there is always more to discover if you are capable of focussing your mind on minutiae. Some people consider a high return on equity to be a good sign of a quality business. So you may wish to see this free collection of companies boasting high return on equity, or this list of stocks with high insider ownership.
Valuation is complex, but we're here to simplify it.
Discover if Tamilnadu Petroproducts might be undervalued or overvalued with our detailed analysis, featuring fair value estimates, potential risks, dividends, insider trades, and its financial condition.
Access Free AnalysisHave feedback on this article? Concerned about the content? Get in touch with us directly. Alternatively, email editorial-team (at) simplywallst.com.
This article by Simply Wall St is general in nature. We provide commentary based on historical data and analyst forecasts only using an unbiased methodology and our articles are not intended to be financial advice. It does not constitute a recommendation to buy or sell any stock, and does not take account of your objectives, or your financial situation. We aim to bring you long-term focused analysis driven by fundamental data. Note that our analysis may not factor in the latest price-sensitive company announcements or qualitative material. Simply Wall St has no position in any stocks mentioned.
About NSEI:TNPETRO
Tamilnadu Petroproducts
Manufactures and sells petrochemical products in India.
Excellent balance sheet with proven track record.
Market Insights

Advertisement
Community Narratives
The company that turned a verb into a global necessity and basically runs the modern internet, digital ads, smartphones, maps, and AI.
Fair Value US$300.00|6.3% undervalued
OS
Community Contributor
Flowers Foods Pays A Fair Price For Health
Fair Value US$16.12|26.0% undervalued
NV
Community Contributor
TMX Group will thrive with 33.3% profit margin and enduring market moat
Fair Value CA$49.90|3.7% overvalued
LI
Community Contributor