
Advertisement
- India
- /
- Paper and Forestry Products
- /
- NSEI:SUNDARAM
Sundaram Multi Pap (NSE:SUNDARAM) May Have Issues Allocating Its Capital
What underlying fundamental trends can indicate that a company might be in decline? Businesses in decline often have two underlying trends, firstly, a declining return on capital employed (ROCE) and a declining base of capital employed. Trends like this ultimately mean the business is reducing its investments and also earning less on what it has invested. And from a first read, things don't look too good at Sundaram Multi Pap (NSE:SUNDARAM), so let's see why.
Return On Capital Employed (ROCE): What Is It?
For those who don't know, ROCE is a measure of a company's yearly pre-tax profit (its return), relative to the capital employed in the business. The formula for this calculation on Sundaram Multi Pap is:
Return on Capital Employed = Earnings Before Interest and Tax (EBIT) ÷ (Total Assets - Current Liabilities)
0.0021 = ₹2.4m ÷ (₹1.3b - ₹180m) (Based on the trailing twelve months to March 2024).
So, Sundaram Multi Pap has an ROCE of 0.2%. Ultimately, that's a low return and it under-performs the Forestry industry average of 12%.
View our latest analysis for Sundaram Multi Pap
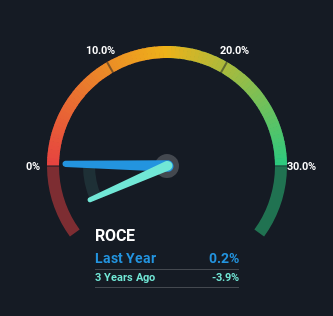
Historical performance is a great place to start when researching a stock so above you can see the gauge for Sundaram Multi Pap's ROCE against it's prior returns. If you'd like to look at how Sundaram Multi Pap has performed in the past in other metrics, you can view this free graph of Sundaram Multi Pap's past earnings, revenue and cash flow.
What The Trend Of ROCE Can Tell Us
We are a bit worried about the trend of returns on capital at Sundaram Multi Pap. Unfortunately the returns on capital have diminished from the 11% that they were earning five years ago. And on the capital employed front, the business is utilizing roughly the same amount of capital as it was back then. Companies that exhibit these attributes tend to not be shrinking, but they can be mature and facing pressure on their margins from competition. If these trends continue, we wouldn't expect Sundaram Multi Pap to turn into a multi-bagger.
On a side note, Sundaram Multi Pap has done well to pay down its current liabilities to 13% of total assets. That could partly explain why the ROCE has dropped. What's more, this can reduce some aspects of risk to the business because now the company's suppliers or short-term creditors are funding less of its operations. Since the business is basically funding more of its operations with it's own money, you could argue this has made the business less efficient at generating ROCE.
What We Can Learn From Sundaram Multi Pap's ROCE
In the end, the trend of lower returns on the same amount of capital isn't typically an indication that we're looking at a growth stock. Yet despite these concerning fundamentals, the stock has performed strongly with a 61% return over the last five years, so investors appear very optimistic. Regardless, we don't feel too comfortable with the fundamentals so we'd be steering clear of this stock for now.
Since virtually every company faces some risks, it's worth knowing what they are, and we've spotted 3 warning signs for Sundaram Multi Pap (of which 1 is a bit unpleasant!) that you should know about.
While Sundaram Multi Pap isn't earning the highest return, check out this free list of companies that are earning high returns on equity with solid balance sheets.
New: Manage All Your Stock Portfolios in One Place
We've created the ultimate portfolio companion for stock investors, and it's free.
• Connect an unlimited number of Portfolios and see your total in one currency
• Be alerted to new Warning Signs or Risks via email or mobile
• Track the Fair Value of your stocks
Have feedback on this article? Concerned about the content? Get in touch with us directly. Alternatively, email editorial-team (at) simplywallst.com.
This article by Simply Wall St is general in nature. We provide commentary based on historical data and analyst forecasts only using an unbiased methodology and our articles are not intended to be financial advice. It does not constitute a recommendation to buy or sell any stock, and does not take account of your objectives, or your financial situation. We aim to bring you long-term focused analysis driven by fundamental data. Note that our analysis may not factor in the latest price-sensitive company announcements or qualitative material. Simply Wall St has no position in any stocks mentioned.
About NSEI:SUNDARAM
Sundaram Multi Pap
Designs, manufactures, and markets paper stationery products for students in India.
Flawless balance sheet and fair value.
Market Insights

Advertisement
Community Narratives
The company that turned a verb into a global necessity and basically runs the modern internet, digital ads, smartphones, maps, and AI.
Fair Value US$300.00|5.1% undervalued
OS
Community Contributor
Flowers Foods Pays A Fair Price For Health
Fair Value US$16.12|27.7% undervalued
NV
Community Contributor
TMX Group will thrive with 33.3% profit margin and enduring market moat
Fair Value CA$49.90|0.2% overvalued
LI
Community Contributor
The "Molecular Pencil": Why Beam's Technology is Built to Win
Fair Value US$65.01|64.4% undervalued
DA
Community Contributor