
Advertisement
Styrenix Performance Materials' (NSE:STYRENIX) Earnings Are Weaker Than They Seem
Styrenix Performance Materials Limited (NSE:STYRENIX) announced strong profits, but the stock was stagnant. We did some digging, and we found some concerning factors in the details.
Examining Cashflow Against Styrenix Performance Materials' Earnings
As finance nerds would already know, the accrual ratio from cashflow is a key measure for assessing how well a company's free cash flow (FCF) matches its profit. To get the accrual ratio we first subtract FCF from profit for a period, and then divide that number by the average operating assets for the period. You could think of the accrual ratio from cashflow as the 'non-FCF profit ratio'.
Therefore, it's actually considered a good thing when a company has a negative accrual ratio, but a bad thing if its accrual ratio is positive. While it's not a problem to have a positive accrual ratio, indicating a certain level of non-cash profits, a high accrual ratio is arguably a bad thing, because it indicates paper profits are not matched by cash flow. To quote a 2014 paper by Lewellen and Resutek, "firms with higher accruals tend to be less profitable in the future".
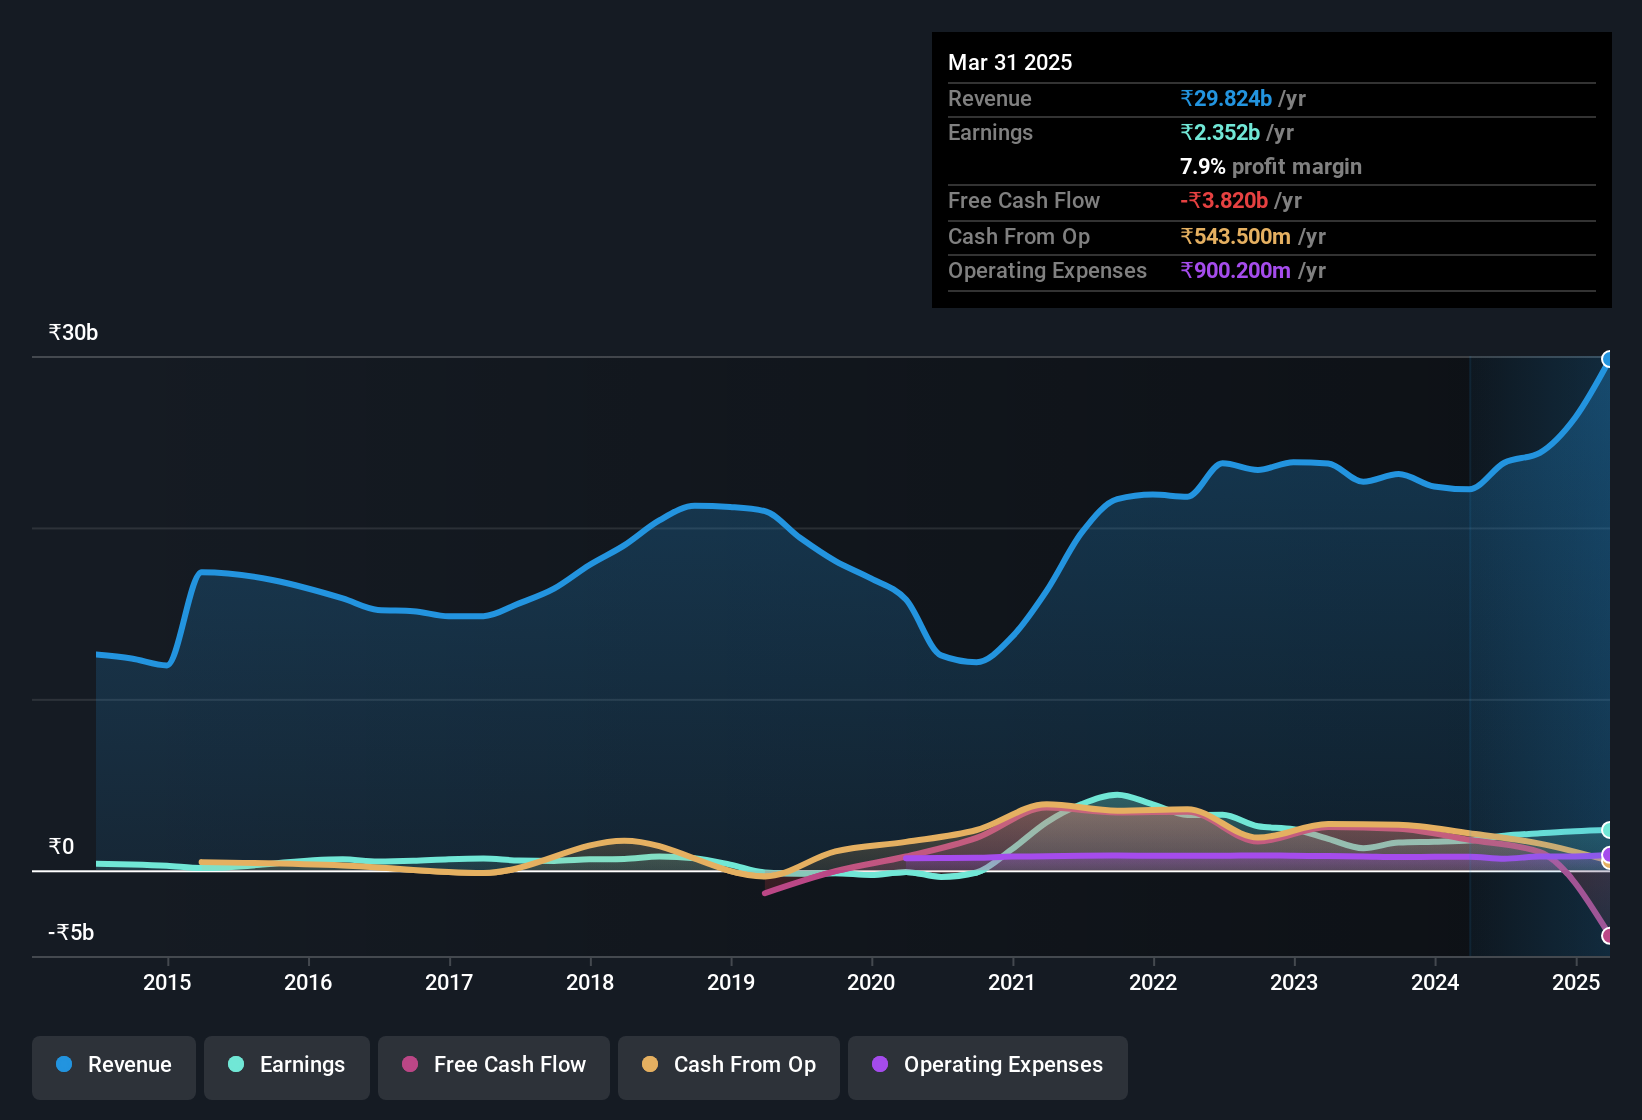
Styrenix Performance Materials has an accrual ratio of 0.66 for the year to March 2025. Statistically speaking, that's a real negative for future earnings. And indeed, during the period the company didn't produce any free cash flow whatsoever. In the last twelve months it actually had negative free cash flow, with an outflow of ₹3.8b despite its profit of ₹2.35b, mentioned above. We saw that FCF was ₹1.8b a year ago though, so Styrenix Performance Materials has at least been able to generate positive FCF in the past. The good news for shareholders is that Styrenix Performance Materials' accrual ratio was much better last year, so this year's poor reading might simply be a case of a short term mismatch between profit and FCF. Shareholders should look for improved cashflow relative to profit in the current year, if that is indeed the case.
Note: we always recommend investors check balance sheet strength. Click here to be taken to our balance sheet analysis of Styrenix Performance Materials.

Our Take On Styrenix Performance Materials' Profit Performance
As we have made quite clear, we're a bit worried that Styrenix Performance Materials didn't back up the last year's profit with free cashflow. As a result, we think it may well be the case that Styrenix Performance Materials' underlying earnings power is lower than its statutory profit. But at least holders can take some solace from the 36% EPS growth in the last year. The goal of this article has been to assess how well we can rely on the statutory earnings to reflect the company's potential, but there is plenty more to consider. In light of this, if you'd like to do more analysis on the company, it's vital to be informed of the risks involved. To help with this, we've discovered 2 warning signs (1 makes us a bit uncomfortable!) that you ought to be aware of before buying any shares in Styrenix Performance Materials.
Today we've zoomed in on a single data point to better understand the nature of Styrenix Performance Materials' profit. But there are plenty of other ways to inform your opinion of a company. Some people consider a high return on equity to be a good sign of a quality business. While it might take a little research on your behalf, you may find this free collection of companies boasting high return on equity, or this list of stocks with significant insider holdings to be useful.
New: Manage All Your Stock Portfolios in One Place
We've created the ultimate portfolio companion for stock investors, and it's free.
• Connect an unlimited number of Portfolios and see your total in one currency
• Be alerted to new Warning Signs or Risks via email or mobile
• Track the Fair Value of your stocks
Have feedback on this article? Concerned about the content? Get in touch with us directly. Alternatively, email editorial-team (at) simplywallst.com.
This article by Simply Wall St is general in nature. We provide commentary based on historical data and analyst forecasts only using an unbiased methodology and our articles are not intended to be financial advice. It does not constitute a recommendation to buy or sell any stock, and does not take account of your objectives, or your financial situation. We aim to bring you long-term focused analysis driven by fundamental data. Note that our analysis may not factor in the latest price-sensitive company announcements or qualitative material. Simply Wall St has no position in any stocks mentioned.
About NSEI:STYRENIX
Styrenix Performance Materials
Engages in the manufacture, trading, and sale of engineering thermoplastics in India.
Excellent balance sheet with proven track record and pays a dividend.
Similar Companies
Market Insights

Advertisement
Community Narratives
The company that turned a verb into a global necessity and basically runs the modern internet, digital ads, smartphones, maps, and AI.
Fair Value US$300.00|7.5% undervalued
OS
Community Contributor
Flowers Foods Pays A Fair Price For Health
Fair Value US$16.12|25.4% undervalued
NV
Community Contributor
TMX Group will thrive with 33.3% profit margin and enduring market moat
Fair Value CA$49.90|3.6% overvalued
LI
Community Contributor
The "Molecular Pencil": Why Beam's Technology is Built to Win
Fair Value US$65.01|65.0% undervalued
DA
Community Contributor