
Advertisement
- India
- /
- Paper and Forestry Products
- /
- NSEI:SHREYANIND
Is Shreyans Industries Limited's (NSE:SHREYANIND) Latest Stock Performance A Reflection Of Its Financial Health?
Most readers would already be aware that Shreyans Industries' (NSE:SHREYANIND) stock increased significantly by 17% over the past three months. Given the company's impressive performance, we decided to study its financial indicators more closely as a company's financial health over the long-term usually dictates market outcomes. Particularly, we will be paying attention to Shreyans Industries' ROE today.
Return on equity or ROE is an important factor to be considered by a shareholder because it tells them how effectively their capital is being reinvested. In short, ROE shows the profit each dollar generates with respect to its shareholder investments.
See our latest analysis for Shreyans Industries
How To Calculate Return On Equity?
Return on equity can be calculated by using the formula:
Return on Equity = Net Profit (from continuing operations) ÷ Shareholders' Equity
So, based on the above formula, the ROE for Shreyans Industries is:
28% = ₹960m ÷ ₹3.5b (Based on the trailing twelve months to September 2023).
The 'return' is the yearly profit. That means that for every ₹1 worth of shareholders' equity, the company generated ₹0.28 in profit.
Why Is ROE Important For Earnings Growth?
So far, we've learned that ROE is a measure of a company's profitability. Depending on how much of these profits the company reinvests or "retains", and how effectively it does so, we are then able to assess a company’s earnings growth potential. Assuming everything else remains unchanged, the higher the ROE and profit retention, the higher the growth rate of a company compared to companies that don't necessarily bear these characteristics.
Shreyans Industries' Earnings Growth And 28% ROE
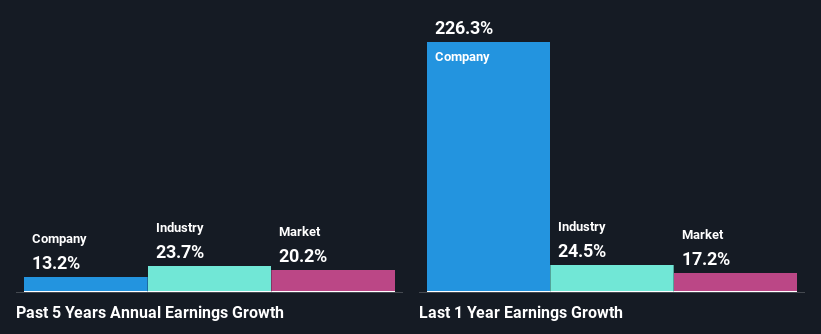
Firstly, we acknowledge that Shreyans Industries has a significantly high ROE. Additionally, the company's ROE is higher compared to the industry average of 12% which is quite remarkable. Probably as a result of this, Shreyans Industries was able to see a decent net income growth of 13% over the last five years.
We then compared Shreyans Industries' net income growth with the industry and found that the company's growth figure is lower than the average industry growth rate of 24% in the same 5-year period, which is a bit concerning.
Earnings growth is a huge factor in stock valuation. The investor should try to establish if the expected growth or decline in earnings, whichever the case may be, is priced in. Doing so will help them establish if the stock's future looks promising or ominous. Is Shreyans Industries fairly valued compared to other companies? These 3 valuation measures might help you decide.
Is Shreyans Industries Efficiently Re-investing Its Profits?
Shreyans Industries' three-year median payout ratio to shareholders is 4.7% (implying that it retains 95% of its income), which is on the lower side, so it seems like the management is reinvesting profits heavily to grow its business.
Moreover, Shreyans Industries is determined to keep sharing its profits with shareholders which we infer from its long history of paying a dividend for at least ten years.
Conclusion
In total, we are pretty happy with Shreyans Industries' performance. Particularly, we like that the company is reinvesting heavily into its business, and at a high rate of return. As a result, the decent growth in its earnings is not surprising. If the company continues to grow its earnings the way it has, that could have a positive impact on its share price given how earnings per share influence long-term share prices. Not to forget, share price outcomes are also dependent on the potential risks a company may face. So it is important for investors to be aware of the risks involved in the business. Our risks dashboard would have the 2 risks we have identified for Shreyans Industries.
New: Manage All Your Stock Portfolios in One Place
We've created the ultimate portfolio companion for stock investors, and it's free.
• Connect an unlimited number of Portfolios and see your total in one currency
• Be alerted to new Warning Signs or Risks via email or mobile
• Track the Fair Value of your stocks
Have feedback on this article? Concerned about the content? Get in touch with us directly. Alternatively, email editorial-team (at) simplywallst.com.
This article by Simply Wall St is general in nature. We provide commentary based on historical data and analyst forecasts only using an unbiased methodology and our articles are not intended to be financial advice. It does not constitute a recommendation to buy or sell any stock, and does not take account of your objectives, or your financial situation. We aim to bring you long-term focused analysis driven by fundamental data. Note that our analysis may not factor in the latest price-sensitive company announcements or qualitative material. Simply Wall St has no position in any stocks mentioned.
About NSEI:SHREYANIND
Shreyans Industries
Engages in the manufacture and sale of writing and printing papers and soda ash in India and internationally.
Flawless balance sheet established dividend payer.
Market Insights

Advertisement
Community Narratives
MicroVision will explode future revenue by 380.37% with a vision towards success
Fair Value US$60.00|98.5% undervalued
TH
Community Contributor
The Indispensable Artery for a New North American Economy
Fair Value CA$132.87|2.3% undervalued
TI
Community Contributor