
Advertisement
- India
- /
- Metals and Mining
- /
- NSEI:MANAKCOAT
Manaksia Coated Metals & Industries Limited's (NSE:MANAKCOAT) 26% Dip Still Leaving Some Shareholders Feeling Restless Over Its P/ERatio
Manaksia Coated Metals & Industries Limited (NSE:MANAKCOAT) shares have retraced a considerable 26% in the last month, reversing a fair amount of their solid recent performance. Looking at the bigger picture, even after this poor month the stock is up 96% in the last year.
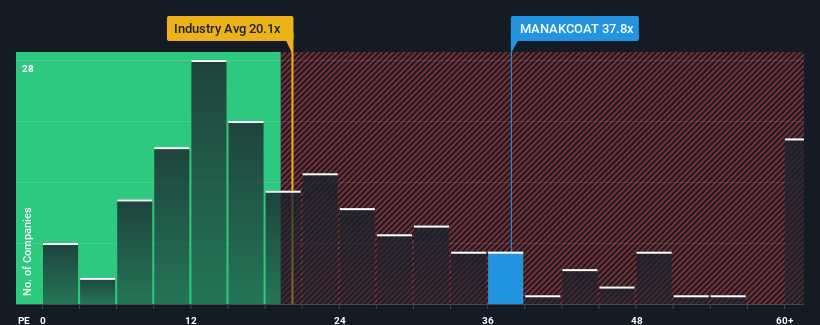
Even after such a large drop in price, given around half the companies in India have price-to-earnings ratios (or "P/E's") below 25x, you may still consider Manaksia Coated Metals & Industries as a stock to potentially avoid with its 37.8x P/E ratio. Although, it's not wise to just take the P/E at face value as there may be an explanation why it's as high as it is.
For example, consider that Manaksia Coated Metals & Industries' financial performance has been pretty ordinary lately as earnings growth is non-existent. One possibility is that the P/E is high because investors think the benign earnings growth will improve to outperform the broader market in the near future. If not, then existing shareholders may be a little nervous about the viability of the share price.
View our latest analysis for Manaksia Coated Metals & Industries
Does Growth Match The High P/E?
Manaksia Coated Metals & Industries' P/E ratio would be typical for a company that's expected to deliver solid growth, and importantly, perform better than the market.
Retrospectively, the last year delivered virtually the same number to the company's bottom line as the year before. Although pleasingly EPS has lifted 103% in aggregate from three years ago, notwithstanding the last 12 months. Accordingly, shareholders would have probably welcomed those medium-term rates of earnings growth.
Weighing that recent medium-term earnings trajectory against the broader market's one-year forecast for expansion of 25% shows it's about the same on an annualised basis.
With this information, we find it interesting that Manaksia Coated Metals & Industries is trading at a high P/E compared to the market. It seems most investors are ignoring the fairly average recent growth rates and are willing to pay up for exposure to the stock. Although, additional gains will be difficult to achieve as a continuation of recent earnings trends would weigh down the share price eventually.
What We Can Learn From Manaksia Coated Metals & Industries' P/E?
Despite the recent share price weakness, Manaksia Coated Metals & Industries' P/E remains higher than most other companies. We'd say the price-to-earnings ratio's power isn't primarily as a valuation instrument but rather to gauge current investor sentiment and future expectations.
We've established that Manaksia Coated Metals & Industries currently trades on a higher than expected P/E since its recent three-year growth is only in line with the wider market forecast. Right now we are uncomfortable with the high P/E as this earnings performance isn't likely to support such positive sentiment for long. If recent medium-term earnings trends continue, it will place shareholders' investments at risk and potential investors in danger of paying an unnecessary premium.
Don't forget that there may be other risks. For instance, we've identified 2 warning signs for Manaksia Coated Metals & Industries (1 is potentially serious) you should be aware of.
It's important to make sure you look for a great company, not just the first idea you come across. So take a peek at this free list of interesting companies with strong recent earnings growth (and a low P/E).
New: Manage All Your Stock Portfolios in One Place
We've created the ultimate portfolio companion for stock investors, and it's free.
• Connect an unlimited number of Portfolios and see your total in one currency
• Be alerted to new Warning Signs or Risks via email or mobile
• Track the Fair Value of your stocks
Have feedback on this article? Concerned about the content? Get in touch with us directly. Alternatively, email editorial-team (at) simplywallst.com.
This article by Simply Wall St is general in nature. We provide commentary based on historical data and analyst forecasts only using an unbiased methodology and our articles are not intended to be financial advice. It does not constitute a recommendation to buy or sell any stock, and does not take account of your objectives, or your financial situation. We aim to bring you long-term focused analysis driven by fundamental data. Note that our analysis may not factor in the latest price-sensitive company announcements or qualitative material. Simply Wall St has no position in any stocks mentioned.
About NSEI:MANAKCOAT
Manaksia Coated Metals & Industries
Manufactures and sells coated metal products in India and internationally.
Solid track record with adequate balance sheet.
Market Insights

Advertisement
Community Narratives
The company that turned a verb into a global necessity and basically runs the modern internet, digital ads, smartphones, maps, and AI.
Fair Value US$300.00|6.3% undervalued
OS
Community Contributor
Flowers Foods Pays A Fair Price For Health
Fair Value US$16.12|26.0% undervalued
NV
Community Contributor
TMX Group will thrive with 33.3% profit margin and enduring market moat
Fair Value CA$49.90|3.7% overvalued
LI
Community Contributor