Stock Analysis
- India
- /
- Metals and Mining
- /
- NSEI:KIOCL
KIOCL (NSE:KIOCL) shareholders notch a 27% CAGR over 5 years, yet earnings have been shrinking


The worst result, after buying shares in a company (assuming no leverage), would be if you lose all the money you put in. But on the bright side, if you buy shares in a high quality company at the right price, you can gain well over 100%. For instance, the price of KIOCL Limited (NSE:KIOCL) stock is up an impressive 224% over the last five years. It's even up 11% in the last week.
After a strong gain in the past week, it's worth seeing if longer term returns have been driven by improving fundamentals.
See our latest analysis for KIOCL
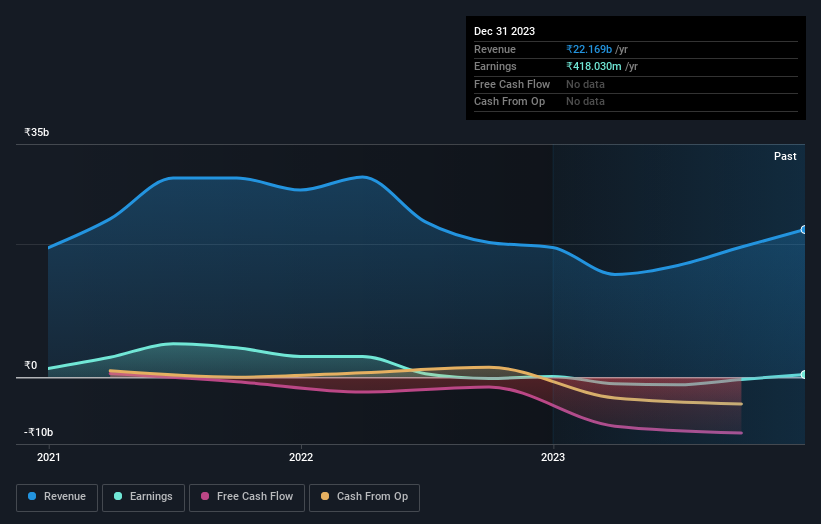
Given that KIOCL only made minimal earnings in the last twelve months, we'll focus on revenue to gauge its business development. As a general rule, we think this kind of company is more comparable to loss-making stocks, since the actual profit is so low. It would be hard to believe in a more profitable future without growing revenues.
For the last half decade, KIOCL can boast revenue growth at a rate of 1.7% per year. That's not a very high growth rate considering the bottom line. In comparison, the share price rise of 27% per year over the last half a decade is pretty impressive. Shareholders should be pretty happy with that, although interested investors might want to examine the financial data more closely to see if the gains are really justified. It may be that the market is pretty optimistic about KIOCL.
The image below shows how earnings and revenue have tracked over time (if you click on the image you can see greater detail).
We're pleased to report that the CEO is remunerated more modestly than most CEOs at similarly capitalized companies. It's always worth keeping an eye on CEO pay, but a more important question is whether the company will grow earnings throughout the years. This free interactive report on KIOCL's earnings, revenue and cash flow is a great place to start, if you want to investigate the stock further.
What About The Total Shareholder Return (TSR)?
We've already covered KIOCL's share price action, but we should also mention its total shareholder return (TSR). Arguably the TSR is a more complete return calculation because it accounts for the value of dividends (as if they were reinvested), along with the hypothetical value of any discounted capital that have been offered to shareholders. Its history of dividend payouts mean that KIOCL's TSR of 235% over the last 5 years is better than the share price return.
A Different Perspective
It's good to see that KIOCL has rewarded shareholders with a total shareholder return of 147% in the last twelve months. Since the one-year TSR is better than the five-year TSR (the latter coming in at 27% per year), it would seem that the stock's performance has improved in recent times. In the best case scenario, this may hint at some real business momentum, implying that now could be a great time to delve deeper. It's always interesting to track share price performance over the longer term. But to understand KIOCL better, we need to consider many other factors. Take risks, for example - KIOCL has 2 warning signs (and 1 which is a bit concerning) we think you should know about.
But note: KIOCL may not be the best stock to buy. So take a peek at this free list of interesting companies with past earnings growth (and further growth forecast).
Please note, the market returns quoted in this article reflect the market weighted average returns of stocks that currently trade on Indian exchanges.
Valuation is complex, but we're helping make it simple.
Find out whether KIOCL is potentially over or undervalued by checking out our comprehensive analysis, which includes fair value estimates, risks and warnings, dividends, insider transactions and financial health.
View the Free AnalysisHave feedback on this article? Concerned about the content? Get in touch with us directly. Alternatively, email editorial-team (at) simplywallst.com.
This article by Simply Wall St is general in nature. We provide commentary based on historical data and analyst forecasts only using an unbiased methodology and our articles are not intended to be financial advice. It does not constitute a recommendation to buy or sell any stock, and does not take account of your objectives, or your financial situation. We aim to bring you long-term focused analysis driven by fundamental data. Note that our analysis may not factor in the latest price-sensitive company announcements or qualitative material. Simply Wall St has no position in any stocks mentioned.
About NSEI:KIOCL
KIOCL
Engages in the iron ore mining, beneficiation, and production in India.
Adequate balance sheet with weak fundamentals.
