9.4% earnings growth over 3 years has not materialized into gains for Kansai Nerolac Paints (NSE:KANSAINER) shareholders over that period


For many investors, the main point of stock picking is to generate higher returns than the overall market. But its virtually certain that sometimes you will buy stocks that fall short of the market average returns. We regret to report that long term Kansai Nerolac Paints Limited (NSE:KANSAINER) shareholders have had that experience, with the share price dropping 30% in three years, versus a market return of about 83%.
Since Kansai Nerolac Paints has shed ₹7.1b from its value in the past 7 days, let's see if the longer term decline has been driven by the business' economics.
Check out our latest analysis for Kansai Nerolac Paints
There is no denying that markets are sometimes efficient, but prices do not always reflect underlying business performance. By comparing earnings per share (EPS) and share price changes over time, we can get a feel for how investor attitudes to a company have morphed over time.
Although the share price is down over three years, Kansai Nerolac Paints actually managed to grow EPS by 31% per year in that time. This is quite a puzzle, and suggests there might be something temporarily buoying the share price. Or else the company was over-hyped in the past, and so its growth has disappointed.
Since the change in EPS doesn't seem to correlate with the change in share price, it's worth taking a look at other metrics.
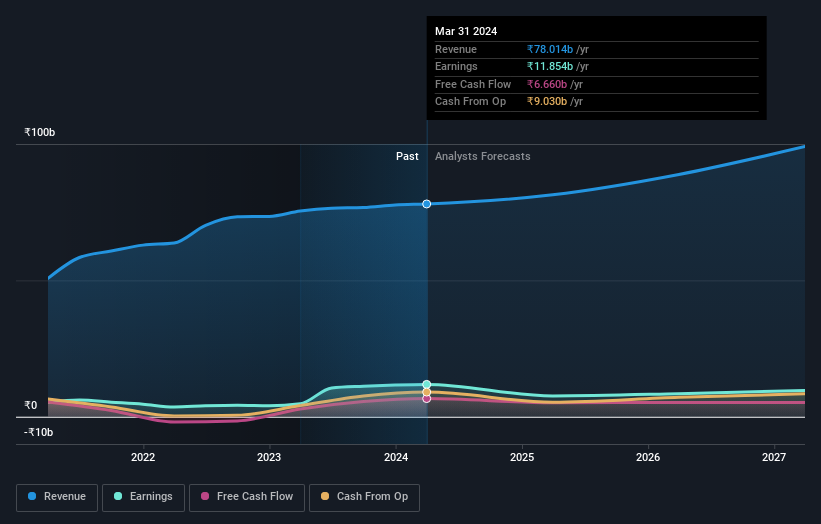
With a rather small yield of just 0.9% we doubt that the stock's share price is based on its dividend. We note that, in three years, revenue has actually grown at a 12% annual rate, so that doesn't seem to be a reason to sell shares. It's probably worth investigating Kansai Nerolac Paints further; while we may be missing something on this analysis, there might also be an opportunity.
You can see how earnings and revenue have changed over time in the image below (click on the chart to see the exact values).
It is of course excellent to see how Kansai Nerolac Paints has grown profits over the years, but the future is more important for shareholders. This free interactive report on Kansai Nerolac Paints' balance sheet strength is a great place to start, if you want to investigate the stock further.
A Different Perspective
While the broader market gained around 49% in the last year, Kansai Nerolac Paints shareholders lost 9.1% (even including dividends). However, keep in mind that even the best stocks will sometimes underperform the market over a twelve month period. Unfortunately, last year's performance may indicate unresolved challenges, given that it was worse than the annualised loss of 0.6% over the last half decade. Generally speaking long term share price weakness can be a bad sign, though contrarian investors might want to research the stock in hope of a turnaround. It's always interesting to track share price performance over the longer term. But to understand Kansai Nerolac Paints better, we need to consider many other factors. Case in point: We've spotted 3 warning signs for Kansai Nerolac Paints you should be aware of, and 1 of them shouldn't be ignored.
We will like Kansai Nerolac Paints better if we see some big insider buys. While we wait, check out this free list of undervalued stocks (mostly small caps) with considerable, recent, insider buying.
Please note, the market returns quoted in this article reflect the market weighted average returns of stocks that currently trade on Indian exchanges.
Valuation is complex, but we're here to simplify it.
Discover if Kansai Nerolac Paints might be undervalued or overvalued with our detailed analysis, featuring fair value estimates, potential risks, dividends, insider trades, and its financial condition.
Access Free AnalysisHave feedback on this article? Concerned about the content? Get in touch with us directly. Alternatively, email editorial-team (at) simplywallst.com.
This article by Simply Wall St is general in nature. We provide commentary based on historical data and analyst forecasts only using an unbiased methodology and our articles are not intended to be financial advice. It does not constitute a recommendation to buy or sell any stock, and does not take account of your objectives, or your financial situation. We aim to bring you long-term focused analysis driven by fundamental data. Note that our analysis may not factor in the latest price-sensitive company announcements or qualitative material. Simply Wall St has no position in any stocks mentioned.
Have feedback on this article? Concerned about the content? Get in touch with us directly. Alternatively, email editorial-team@simplywallst.com
About NSEI:KANSAINER
Kansai Nerolac Paints
Manufactures and supplies paints and varnishes, enamels, and lacquers in India.
Excellent balance sheet average dividend payer.

