Himadri Speciality Chemical (NSE:HSCL) jumps 11% this week, though earnings growth is still tracking behind three-year shareholder returns


For us, stock picking is in large part the hunt for the truly magnificent stocks. But when you hold the right stock for the right time period, the rewards can be truly huge. One bright shining star stock has been Himadri Speciality Chemical Limited (NSE:HSCL), which is 577% higher than three years ago. It's also good to see the share price up 28% over the last quarter. But this could be related to the strong market, which is up 13% in the last three months. It really delights us to see such great share price performance for investors.
Since the stock has added ₹20b to its market cap in the past week alone, let's see if underlying performance has been driving long-term returns.
See our latest analysis for Himadri Speciality Chemical
In his essay The Superinvestors of Graham-and-Doddsville Warren Buffett described how share prices do not always rationally reflect the value of a business. One flawed but reasonable way to assess how sentiment around a company has changed is to compare the earnings per share (EPS) with the share price.
Himadri Speciality Chemical was able to grow its EPS at 94% per year over three years, sending the share price higher. We don't think it is entirely coincidental that the EPS growth is reasonably close to the 89% average annual increase in the share price. This suggests that sentiment and expectations have not changed drastically. Au contraire, the share price change has arguably mimicked the EPS growth.
You can see below how EPS has changed over time (discover the exact values by clicking on the image).
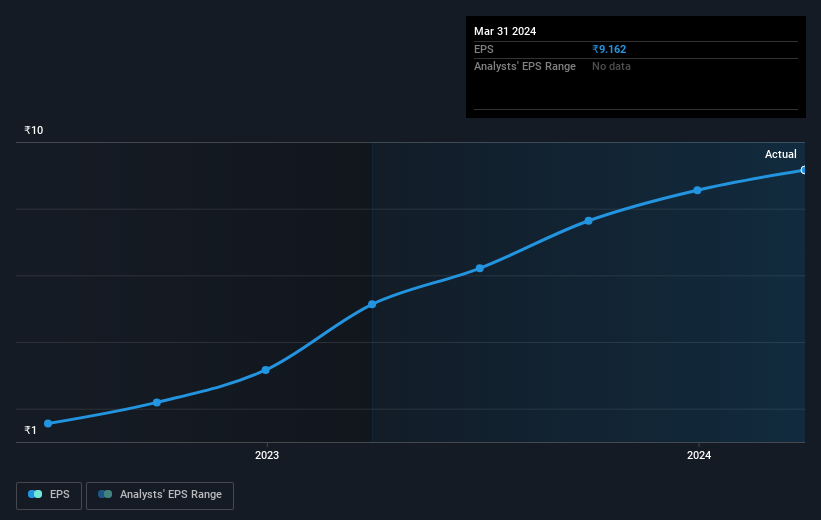
This free interactive report on Himadri Speciality Chemical's earnings, revenue and cash flow is a great place to start, if you want to investigate the stock further.
What About Dividends?
As well as measuring the share price return, investors should also consider the total shareholder return (TSR). The TSR incorporates the value of any spin-offs or discounted capital raisings, along with any dividends, based on the assumption that the dividends are reinvested. It's fair to say that the TSR gives a more complete picture for stocks that pay a dividend. As it happens, Himadri Speciality Chemical's TSR for the last 3 years was 583%, which exceeds the share price return mentioned earlier. The dividends paid by the company have thusly boosted the total shareholder return.
A Different Perspective
It's good to see that Himadri Speciality Chemical has rewarded shareholders with a total shareholder return of 200% in the last twelve months. And that does include the dividend. That gain is better than the annual TSR over five years, which is 31%. Therefore it seems like sentiment around the company has been positive lately. Someone with an optimistic perspective could view the recent improvement in TSR as indicating that the business itself is getting better with time. I find it very interesting to look at share price over the long term as a proxy for business performance. But to truly gain insight, we need to consider other information, too. For instance, we've identified 1 warning sign for Himadri Speciality Chemical that you should be aware of.
If you are like me, then you will not want to miss this free list of undervalued small caps that insiders are buying.
Please note, the market returns quoted in this article reflect the market weighted average returns of stocks that currently trade on Indian exchanges.
Valuation is complex, but we're here to simplify it.
Discover if Himadri Speciality Chemical might be undervalued or overvalued with our detailed analysis, featuring fair value estimates, potential risks, dividends, insider trades, and its financial condition.
Access Free AnalysisHave feedback on this article? Concerned about the content? Get in touch with us directly. Alternatively, email editorial-team (at) simplywallst.com.
This article by Simply Wall St is general in nature. We provide commentary based on historical data and analyst forecasts only using an unbiased methodology and our articles are not intended to be financial advice. It does not constitute a recommendation to buy or sell any stock, and does not take account of your objectives, or your financial situation. We aim to bring you long-term focused analysis driven by fundamental data. Note that our analysis may not factor in the latest price-sensitive company announcements or qualitative material. Simply Wall St has no position in any stocks mentioned.
Have feedback on this article? Concerned about the content? Get in touch with us directly. Alternatively, email editorial-team@simplywallst.com
About NSEI:HSCL
Himadri Speciality Chemical
Manufactures and sells carbon materials and chemicals in India and internationally.
Flawless balance sheet with solid track record.

