Reflecting on Clariant Chemicals (India)'s(NSE:CLNINDIA) Total Shareholder Returns Over The Last Five Years
Ideally, your overall portfolio should beat the market average. But the main game is to find enough winners to more than offset the losers So we wouldn't blame long term Clariant Chemicals (India) Limited (NSE:CLNINDIA) shareholders for doubting their decision to hold, with the stock down 56% over a half decade. Shareholders have had an even rougher run lately, with the share price down 18% in the last 90 days.
See our latest analysis for Clariant Chemicals (India)
There is no denying that markets are sometimes efficient, but prices do not always reflect underlying business performance. One flawed but reasonable way to assess how sentiment around a company has changed is to compare the earnings per share (EPS) with the share price.
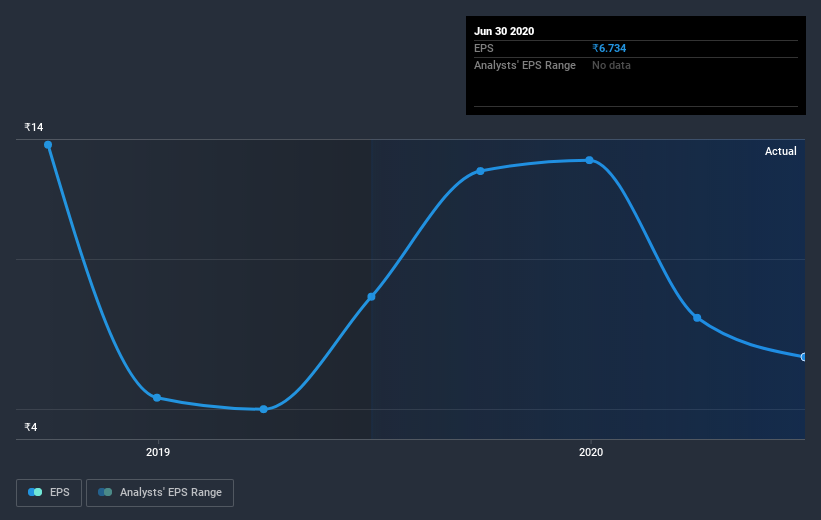
Looking back five years, both Clariant Chemicals (India)'s share price and EPS declined; the latter at a rate of 54% per year. The share price decline of 15% per year isn't as bad as the EPS decline. So the market may previously have expected a drop, or else it expects the situation will improve. The high P/E ratio of 49.29 suggests that shareholders believe earnings will grow in the years ahead.
The image below shows how EPS has tracked over time (if you click on the image you can see greater detail).

Before buying or selling a stock, we always recommend a close examination of historic growth trends, available here.
What About Dividends?
When looking at investment returns, it is important to consider the difference between total shareholder return (TSR) and share price return. The TSR incorporates the value of any spin-offs or discounted capital raisings, along with any dividends, based on the assumption that the dividends are reinvested. So for companies that pay a generous dividend, the TSR is often a lot higher than the share price return. In the case of Clariant Chemicals (India), it has a TSR of -34% for the last 5 years. That exceeds its share price return that we previously mentioned. The dividends paid by the company have thusly boosted the total shareholder return.
A Different Perspective
It's good to see that Clariant Chemicals (India) has rewarded shareholders with a total shareholder return of 48% in the last twelve months. Of course, that includes the dividend. There's no doubt those recent returns are much better than the TSR loss of 6% per year over five years. This makes us a little wary, but the business might have turned around its fortunes. I find it very interesting to look at share price over the long term as a proxy for business performance. But to truly gain insight, we need to consider other information, too. To that end, you should learn about the 3 warning signs we've spotted with Clariant Chemicals (India) (including 1 which is makes us a bit uncomfortable) .
We will like Clariant Chemicals (India) better if we see some big insider buys. While we wait, check out this free list of growing companies with considerable, recent, insider buying.
Please note, the market returns quoted in this article reflect the market weighted average returns of stocks that currently trade on IN exchanges.
When trading Clariant Chemicals (India) or any other investment, use the platform considered by many to be the Professional's Gateway to the Worlds Market, Interactive Brokers. You get the lowest-cost* trading on stocks, options, futures, forex, bonds and funds worldwide from a single integrated account. Promoted
Valuation is complex, but we're here to simplify it.
Discover if Heubach Colorants India might be undervalued or overvalued with our detailed analysis, featuring fair value estimates, potential risks, dividends, insider trades, and its financial condition.
Access Free AnalysisThis article by Simply Wall St is general in nature. It does not constitute a recommendation to buy or sell any stock, and does not take account of your objectives, or your financial situation. We aim to bring you long-term focused analysis driven by fundamental data. Note that our analysis may not factor in the latest price-sensitive company announcements or qualitative material. Simply Wall St has no position in any stocks mentioned.
*Interactive Brokers Rated Lowest Cost Broker by StockBrokers.com Annual Online Review 2020
Have feedback on this article? Concerned about the content? Get in touch with us directly. Alternatively, email editorial-team@simplywallst.com.
About NSEI:HEUBACHIND
Heubach Colorants India
Engages in the manufacture and sale of specialty chemicals in India and internationally.
Flawless balance sheet and good value.
Similar Companies
Market Insights
Community Narratives


