Stock Analysis
- India
- /
- Paper and Forestry Products
- /
- NSEI:CENTURYPLY
Century Plyboards (India) (NSE:CENTURYPLY) sheds 4.0% this week, as yearly returns fall more in line with earnings growth

When you buy a stock there is always a possibility that it could drop 100%. But on the bright side, you can make far more than 100% on a really good stock. Long term Century Plyboards (India) Limited (NSE:CENTURYPLY) shareholders would be well aware of this, since the stock is up 297% in five years. It's also good to see the share price up 12% over the last quarter. But this could be related to the strong market, which is up 19% in the last three months.
While the stock has fallen 4.0% this week, it's worth focusing on the longer term and seeing if the stocks historical returns have been driven by the underlying fundamentals.
Check out our latest analysis for Century Plyboards (India)
To paraphrase Benjamin Graham: Over the short term the market is a voting machine, but over the long term it's a weighing machine. By comparing earnings per share (EPS) and share price changes over time, we can get a feel for how investor attitudes to a company have morphed over time.
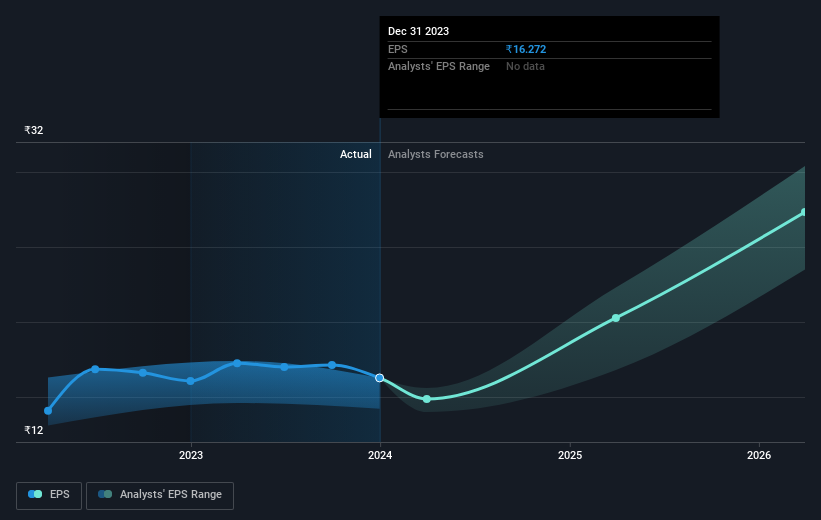
Over half a decade, Century Plyboards (India) managed to grow its earnings per share at 19% a year. This EPS growth is lower than the 32% average annual increase in the share price. So it's fair to assume the market has a higher opinion of the business than it did five years ago. That's not necessarily surprising considering the five-year track record of earnings growth.
You can see how EPS has changed over time in the image below (click on the chart to see the exact values).
We know that Century Plyboards (India) has improved its bottom line over the last three years, but what does the future have in store? This free interactive report on Century Plyboards (India)'s balance sheet strength is a great place to start, if you want to investigate the stock further.
What About Dividends?
As well as measuring the share price return, investors should also consider the total shareholder return (TSR). Whereas the share price return only reflects the change in the share price, the TSR includes the value of dividends (assuming they were reinvested) and the benefit of any discounted capital raising or spin-off. So for companies that pay a generous dividend, the TSR is often a lot higher than the share price return. As it happens, Century Plyboards (India)'s TSR for the last 5 years was 305%, which exceeds the share price return mentioned earlier. And there's no prize for guessing that the dividend payments largely explain the divergence!
A Different Perspective
Century Plyboards (India) shareholders are up 40% for the year (even including dividends). But that return falls short of the market. On the bright side, that's still a gain, and it's actually better than the average return of 32% over half a decade This suggests the company might be improving over time. Is Century Plyboards (India) cheap compared to other companies? These 3 valuation measures might help you decide.
Of course Century Plyboards (India) may not be the best stock to buy. So you may wish to see this free collection of growth stocks.
Please note, the market returns quoted in this article reflect the market weighted average returns of stocks that currently trade on Indian exchanges.
Valuation is complex, but we're helping make it simple.
Find out whether Century Plyboards (India) is potentially over or undervalued by checking out our comprehensive analysis, which includes fair value estimates, risks and warnings, dividends, insider transactions and financial health.
View the Free AnalysisHave feedback on this article? Concerned about the content? Get in touch with us directly. Alternatively, email editorial-team (at) simplywallst.com.
This article by Simply Wall St is general in nature. We provide commentary based on historical data and analyst forecasts only using an unbiased methodology and our articles are not intended to be financial advice. It does not constitute a recommendation to buy or sell any stock, and does not take account of your objectives, or your financial situation. We aim to bring you long-term focused analysis driven by fundamental data. Note that our analysis may not factor in the latest price-sensitive company announcements or qualitative material. Simply Wall St has no position in any stocks mentioned.
About NSEI:CENTURYPLY
Century Plyboards (India)
Century Plyboards (India) Limited manufactures and sells plywood, laminates, decorative veneers, medium density fiber boards (MDF), pre-laminated boards, particle boards, and flush doors in India.
Flawless balance sheet with reasonable growth potential.

