
Advertisement
- India
- /
- Paper and Forestry Products
- /
- NSEI:ARCHIDPLY
Archidply Industries (NSE:ARCHIDPLY) Is Finding It Tricky To Allocate Its Capital
Ignoring the stock price of a company, what are the underlying trends that tell us a business is past the growth phase? A business that's potentially in decline often shows two trends, a return on capital employed (ROCE) that's declining, and a base of capital employed that's also declining. Trends like this ultimately mean the business is reducing its investments and also earning less on what it has invested. Having said that, after a brief look, Archidply Industries (NSE:ARCHIDPLY) we aren't filled with optimism, but let's investigate further.
Understanding Return On Capital Employed (ROCE)
If you haven't worked with ROCE before, it measures the 'return' (pre-tax profit) a company generates from capital employed in its business. To calculate this metric for Archidply Industries, this is the formula:
Return on Capital Employed = Earnings Before Interest and Tax (EBIT) ÷ (Total Assets - Current Liabilities)
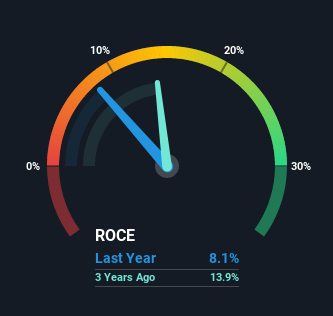
0.081 = ₹81m ÷ (₹1.8b - ₹786m) (Based on the trailing twelve months to December 2020).
So, Archidply Industries has an ROCE of 8.1%. Ultimately, that's a low return and it under-performs the Forestry industry average of 10%.
Check out our latest analysis for Archidply Industries
While the past is not representative of the future, it can be helpful to know how a company has performed historically, which is why we have this chart above. If you'd like to look at how Archidply Industries has performed in the past in other metrics, you can view this free graph of past earnings, revenue and cash flow.
What The Trend Of ROCE Can Tell Us
In terms of Archidply Industries' historical ROCE trend, it isn't fantastic. To be more specific, today's ROCE was 13% five years ago but has since fallen to 8.1%. What's equally concerning is that the amount of capital deployed in the business has shrunk by 22% over that same period. The fact that both are shrinking is an indication that the business is going through some tough times. Typically businesses that exhibit these characteristics aren't the ones that tend to multiply over the long term, because statistically speaking, they've already gone through the growth phase of their life cycle.
On a side note, Archidply Industries' current liabilities are still rather high at 44% of total assets. This effectively means that suppliers (or short-term creditors) are funding a large portion of the business, so just be aware that this can introduce some elements of risk. Ideally we'd like to see this reduce as that would mean fewer obligations bearing risks.
What We Can Learn From Archidply Industries' ROCE
In short, lower returns and decreasing amounts capital employed in the business doesn't fill us with confidence. It should come as no surprise then that the stock has fallen 11% over the last five years, so it looks like investors are recognizing these changes. Unless there is a shift to a more positive trajectory in these metrics, we would look elsewhere.
If you'd like to know more about Archidply Industries, we've spotted 4 warning signs, and 3 of them shouldn't be ignored.
While Archidply Industries isn't earning the highest return, check out this free list of companies that are earning high returns on equity with solid balance sheets.
If you’re looking to trade Archidply Industries, open an account with the lowest-cost* platform trusted by professionals, Interactive Brokers. Their clients from over 200 countries and territories trade stocks, options, futures, forex, bonds and funds worldwide from a single integrated account. Promoted
New: Manage All Your Stock Portfolios in One Place
We've created the ultimate portfolio companion for stock investors, and it's free.
• Connect an unlimited number of Portfolios and see your total in one currency
• Be alerted to new Warning Signs or Risks via email or mobile
• Track the Fair Value of your stocks
This article by Simply Wall St is general in nature. It does not constitute a recommendation to buy or sell any stock, and does not take account of your objectives, or your financial situation. We aim to bring you long-term focused analysis driven by fundamental data. Note that our analysis may not factor in the latest price-sensitive company announcements or qualitative material. Simply Wall St has no position in any stocks mentioned.
*Interactive Brokers Rated Lowest Cost Broker by StockBrokers.com Annual Online Review 2020
Have feedback on this article? Concerned about the content? Get in touch with us directly. Alternatively, email editorial-team (at) simplywallst.com.
About NSEI:ARCHIDPLY
Archidply Industries
Manufactures and sells wood and paper based products in India and internationally.
Acceptable track record with imperfect balance sheet.
Similar Companies
Market Insights

Advertisement
Community Narratives
MicroVision will explode future revenue by 380.37% with a vision towards success
Fair Value US$60.00|98.3% undervalued
TH
Community Contributor
The Indispensable Artery for a New North American Economy
Fair Value CA$132.87|1.0% undervalued
TI
Community Contributor