- India
- /
- Healthcare Services
- /
- NSEI:LALPATHLAB
Dr. Lal PathLabs (NSE:LALPATHLAB) shareholders have earned a 21% CAGR over the last five years


The most you can lose on any stock (assuming you don't use leverage) is 100% of your money. But on the bright side, you can make far more than 100% on a really good stock. For instance, the price of Dr. Lal PathLabs Limited (NSE:LALPATHLAB) stock is up an impressive 146% over the last five years. It's also good to see the share price up 27% over the last quarter. But this could be related to the strong market, which is up 13% in the last three months.
So let's assess the underlying fundamentals over the last 5 years and see if they've moved in lock-step with shareholder returns.
View our latest analysis for Dr. Lal PathLabs
There is no denying that markets are sometimes efficient, but prices do not always reflect underlying business performance. By comparing earnings per share (EPS) and share price changes over time, we can get a feel for how investor attitudes to a company have morphed over time.
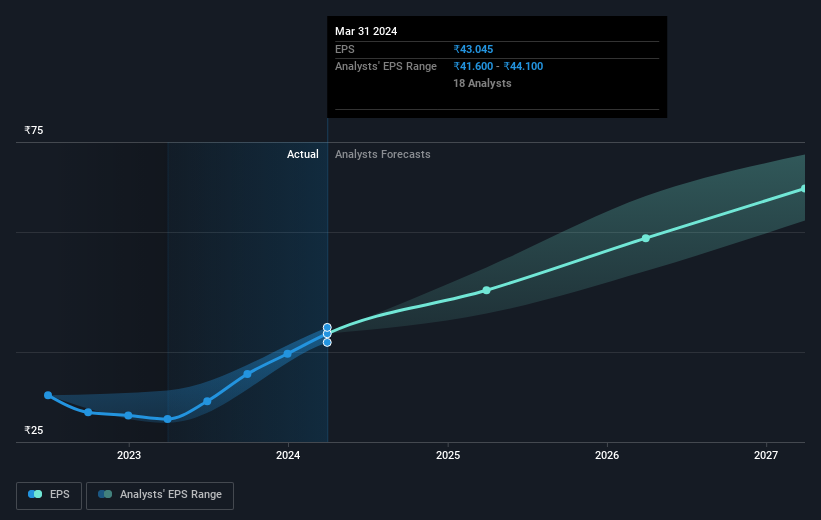
During five years of share price growth, Dr. Lal PathLabs achieved compound earnings per share (EPS) growth of 12% per year. This EPS growth is slower than the share price growth of 20% per year, over the same period. This suggests that market participants hold the company in higher regard, these days. And that's hardly shocking given the track record of growth. This favorable sentiment is reflected in its (fairly optimistic) P/E ratio of 62.78.
You can see below how EPS has changed over time (discover the exact values by clicking on the image).
We know that Dr. Lal PathLabs has improved its bottom line lately, but is it going to grow revenue? Check if analysts think Dr. Lal PathLabs will grow revenue in the future.
What About Dividends?
When looking at investment returns, it is important to consider the difference between total shareholder return (TSR) and share price return. Whereas the share price return only reflects the change in the share price, the TSR includes the value of dividends (assuming they were reinvested) and the benefit of any discounted capital raising or spin-off. So for companies that pay a generous dividend, the TSR is often a lot higher than the share price return. As it happens, Dr. Lal PathLabs' TSR for the last 5 years was 155%, which exceeds the share price return mentioned earlier. This is largely a result of its dividend payments!
A Different Perspective
Dr. Lal PathLabs shareholders gained a total return of 25% during the year. Unfortunately this falls short of the market return. The silver lining is that the gain was actually better than the average annual return of 21% per year over five year. It is possible that returns will improve along with the business fundamentals. While it is well worth considering the different impacts that market conditions can have on the share price, there are other factors that are even more important. Consider risks, for instance. Every company has them, and we've spotted 2 warning signs for Dr. Lal PathLabs you should know about.
For those who like to find winning investments this free list of undervalued companies with recent insider purchasing, could be just the ticket.
Please note, the market returns quoted in this article reflect the market weighted average returns of stocks that currently trade on Indian exchanges.
New: Manage All Your Stock Portfolios in One Place
We've created the ultimate portfolio companion for stock investors, and it's free.
• Connect an unlimited number of Portfolios and see your total in one currency
• Be alerted to new Warning Signs or Risks via email or mobile
• Track the Fair Value of your stocks
Have feedback on this article? Concerned about the content? Get in touch with us directly. Alternatively, email editorial-team (at) simplywallst.com.
This article by Simply Wall St is general in nature. We provide commentary based on historical data and analyst forecasts only using an unbiased methodology and our articles are not intended to be financial advice. It does not constitute a recommendation to buy or sell any stock, and does not take account of your objectives, or your financial situation. We aim to bring you long-term focused analysis driven by fundamental data. Note that our analysis may not factor in the latest price-sensitive company announcements or qualitative material. Simply Wall St has no position in any stocks mentioned.
Have feedback on this article? Concerned about the content? Get in touch with us directly. Alternatively, email editorial-team@simplywallst.com
About NSEI:LALPATHLAB
Dr. Lal PathLabs
Operates laboratories for carrying out pathological investigations in India and internationally.
Outstanding track record with excellent balance sheet.

