- India
- /
- Healthcare Services
- /
- NSEI:ASTERDM
Aster DM Healthcare Limited's (NSE:ASTERDM) Stock's Been Going Strong: Could Weak Financials Mean The Market Will Correct Its Share Price?


Aster DM Healthcare (NSE:ASTERDM) has had a great run on the share market with its stock up by a significant 23% over the last month. However, we decided to pay close attention to its weak financials as we are doubtful that the current momentum will keep up, given the scenario. Specifically, we decided to study Aster DM Healthcare's ROE in this article.
Return on equity or ROE is an important factor to be considered by a shareholder because it tells them how effectively their capital is being reinvested. Simply put, it is used to assess the profitability of a company in relation to its equity capital.
See our latest analysis for Aster DM Healthcare
How To Calculate Return On Equity?
Return on equity can be calculated by using the formula:
Return on Equity = Net Profit (from continuing operations) ÷ Shareholders' Equity
So, based on the above formula, the ROE for Aster DM Healthcare is:
4.8% = ₹2.4b ÷ ₹50b (Based on the trailing twelve months to June 2024).
The 'return' refers to a company's earnings over the last year. Another way to think of that is that for every ₹1 worth of equity, the company was able to earn ₹0.05 in profit.
What Is The Relationship Between ROE And Earnings Growth?
We have already established that ROE serves as an efficient profit-generating gauge for a company's future earnings. Depending on how much of these profits the company reinvests or "retains", and how effectively it does so, we are then able to assess a company’s earnings growth potential. Assuming all else is equal, companies that have both a higher return on equity and higher profit retention are usually the ones that have a higher growth rate when compared to companies that don't have the same features.
Aster DM Healthcare's Earnings Growth And 4.8% ROE
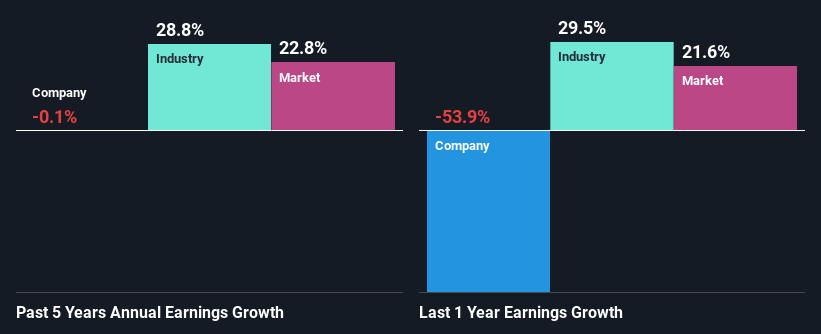
It is hard to argue that Aster DM Healthcare's ROE is much good in and of itself. Even compared to the average industry ROE of 12%, the company's ROE is quite dismal. Therefore, Aster DM Healthcare's flat earnings over the past five years can possibly be explained by the low ROE amongst other factors.
As a next step, we compared Aster DM Healthcare's net income growth with the industry and discovered that the industry saw an average growth of 29% in the same period.
Earnings growth is an important metric to consider when valuing a stock. It’s important for an investor to know whether the market has priced in the company's expected earnings growth (or decline). By doing so, they will have an idea if the stock is headed into clear blue waters or if swampy waters await. One good indicator of expected earnings growth is the P/E ratio which determines the price the market is willing to pay for a stock based on its earnings prospects. So, you may want to check if Aster DM Healthcare is trading on a high P/E or a low P/E, relative to its industry.
Is Aster DM Healthcare Making Efficient Use Of Its Profits?
With a high three-year median payout ratio of 81% (implying that the company keeps only 19% of its income) of its business to reinvest into its business), most of Aster DM Healthcare's profits are being paid to shareholders, which explains the absence of growth in earnings.
Summary
On the whole, Aster DM Healthcare's performance is quite a big let-down. Because the company is not reinvesting much into the business, and given the low ROE, it's not surprising to see the lack or absence of growth in its earnings. That being so, the latest industry analyst forecasts show that the analysts are expecting to see a huge improvement in the company's earnings growth rate. To know more about the latest analysts predictions for the company, check out this visualization of analyst forecasts for the company.
New: Manage All Your Stock Portfolios in One Place
We've created the ultimate portfolio companion for stock investors, and it's free.
• Connect an unlimited number of Portfolios and see your total in one currency
• Be alerted to new Warning Signs or Risks via email or mobile
• Track the Fair Value of your stocks
Have feedback on this article? Concerned about the content? Get in touch with us directly. Alternatively, email editorial-team (at) simplywallst.com.
This article by Simply Wall St is general in nature. We provide commentary based on historical data and analyst forecasts only using an unbiased methodology and our articles are not intended to be financial advice. It does not constitute a recommendation to buy or sell any stock, and does not take account of your objectives, or your financial situation. We aim to bring you long-term focused analysis driven by fundamental data. Note that our analysis may not factor in the latest price-sensitive company announcements or qualitative material. Simply Wall St has no position in any stocks mentioned.
About NSEI:ASTERDM
Aster DM Healthcare
Provides healthcare and allied services in India, the United Arab Emirates, Qatar, Oman, Kingdom of Saudi Arabia, Jordan, Kuwait and Bahrain, and Republic of Mauritius.
Excellent balance sheet with reasonable growth potential.
