Stock Analysis
- India
- /
- Oil and Gas
- /
- NSEI:GMDCLTD
Gujarat Mineral Development's (NSE:GMDCLTD) three-year total shareholder returns outpace the underlying earnings growth
For us, stock picking is in large part the hunt for the truly magnificent stocks. But when you hold the right stock for the right time period, the rewards can be truly huge. One such superstar is Gujarat Mineral Development Corporation Limited (NSE:GMDCLTD), which saw its share price soar 671% in three years. Also pleasing for shareholders was the 15% gain in the last three months. But this could be related to the strong market, which is up 15% in the last three months. It really delights us to see such great share price performance for investors.
While this past week has detracted from the company's three-year return, let's look at the recent trends of the underlying business and see if the gains have been in alignment.
See our latest analysis for Gujarat Mineral Development
There is no denying that markets are sometimes efficient, but prices do not always reflect underlying business performance. By comparing earnings per share (EPS) and share price changes over time, we can get a feel for how investor attitudes to a company have morphed over time.
During three years of share price growth, Gujarat Mineral Development achieved compound earnings per share growth of 67% per year. This EPS growth is lower than the 98% average annual increase in the share price. This suggests that, as the business progressed over the last few years, it gained the confidence of market participants. It is quite common to see investors become enamoured with a business, after a few years of solid progress.
The company's earnings per share (over time) is depicted in the image below (click to see the exact numbers).
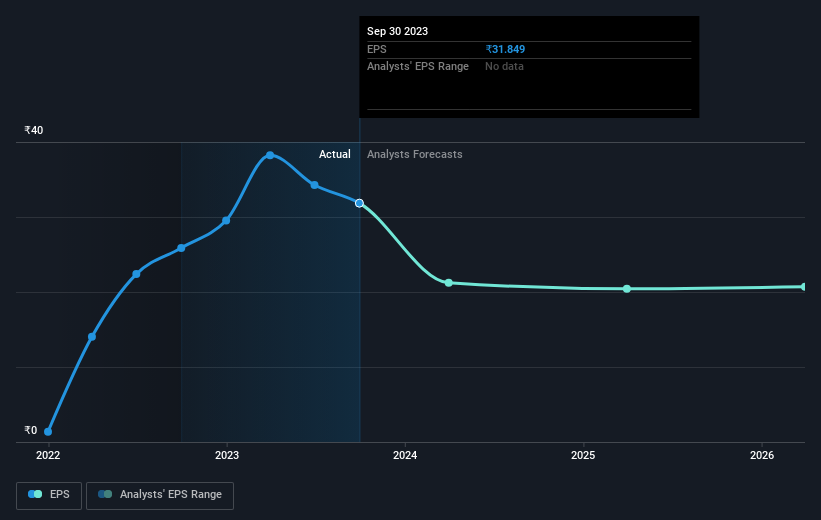
It is of course excellent to see how Gujarat Mineral Development has grown profits over the years, but the future is more important for shareholders. It might be well worthwhile taking a look at our free report on how its financial position has changed over time.
What About Dividends?
When looking at investment returns, it is important to consider the difference between total shareholder return (TSR) and share price return. The TSR is a return calculation that accounts for the value of cash dividends (assuming that any dividend received was reinvested) and the calculated value of any discounted capital raisings and spin-offs. Arguably, the TSR gives a more comprehensive picture of the return generated by a stock. In the case of Gujarat Mineral Development, it has a TSR of 729% for the last 3 years. That exceeds its share price return that we previously mentioned. The dividends paid by the company have thusly boosted the total shareholder return.
A Different Perspective
It's nice to see that Gujarat Mineral Development shareholders have received a total shareholder return of 208% over the last year. That's including the dividend. Since the one-year TSR is better than the five-year TSR (the latter coming in at 45% per year), it would seem that the stock's performance has improved in recent times. In the best case scenario, this may hint at some real business momentum, implying that now could be a great time to delve deeper. It's always interesting to track share price performance over the longer term. But to understand Gujarat Mineral Development better, we need to consider many other factors. To that end, you should learn about the 3 warning signs we've spotted with Gujarat Mineral Development (including 1 which is significant) .
Of course, you might find a fantastic investment by looking elsewhere. So take a peek at this free list of companies we expect will grow earnings.
Please note, the market returns quoted in this article reflect the market weighted average returns of stocks that currently trade on Indian exchanges.
Valuation is complex, but we're helping make it simple.
Find out whether Gujarat Mineral Development is potentially over or undervalued by checking out our comprehensive analysis, which includes fair value estimates, risks and warnings, dividends, insider transactions and financial health.
View the Free AnalysisHave feedback on this article? Concerned about the content? Get in touch with us directly. Alternatively, email editorial-team (at) simplywallst.com.
This article by Simply Wall St is general in nature. We provide commentary based on historical data and analyst forecasts only using an unbiased methodology and our articles are not intended to be financial advice. It does not constitute a recommendation to buy or sell any stock, and does not take account of your objectives, or your financial situation. We aim to bring you long-term focused analysis driven by fundamental data. Note that our analysis may not factor in the latest price-sensitive company announcements or qualitative material. Simply Wall St has no position in any stocks mentioned.
About NSEI:GMDCLTD
Gujarat Mineral Development
Gujarat Mineral Development Corporation Limited engages in mining business in India.
Excellent balance sheet average dividend payer.

