Stock Analysis
- India
- /
- Consumer Finance
- /
- NSEI:SUNDARMFIN
Sundaram Finance (NSE:SUNDARMFIN) jumps 7.2% this week, though earnings growth is still tracking behind three-year shareholder returns

The most you can lose on any stock (assuming you don't use leverage) is 100% of your money. But if you buy shares in a really great company, you can more than double your money. For instance the Sundaram Finance Limited (NSE:SUNDARMFIN) share price is 152% higher than it was three years ago. Most would be happy with that. On top of that, the share price is up 28% in about a quarter.
Since the stock has added ₹24b to its market cap in the past week alone, let's see if underlying performance has been driving long-term returns.
See our latest analysis for Sundaram Finance
While markets are a powerful pricing mechanism, share prices reflect investor sentiment, not just underlying business performance. One flawed but reasonable way to assess how sentiment around a company has changed is to compare the earnings per share (EPS) with the share price.
Sundaram Finance was able to grow its EPS at 18% per year over three years, sending the share price higher. This EPS growth is lower than the 36% average annual increase in the share price. So it's fair to assume the market has a higher opinion of the business than it did three years ago. It is quite common to see investors become enamoured with a business, after a few years of solid progress.
The company's earnings per share (over time) is depicted in the image below (click to see the exact numbers).
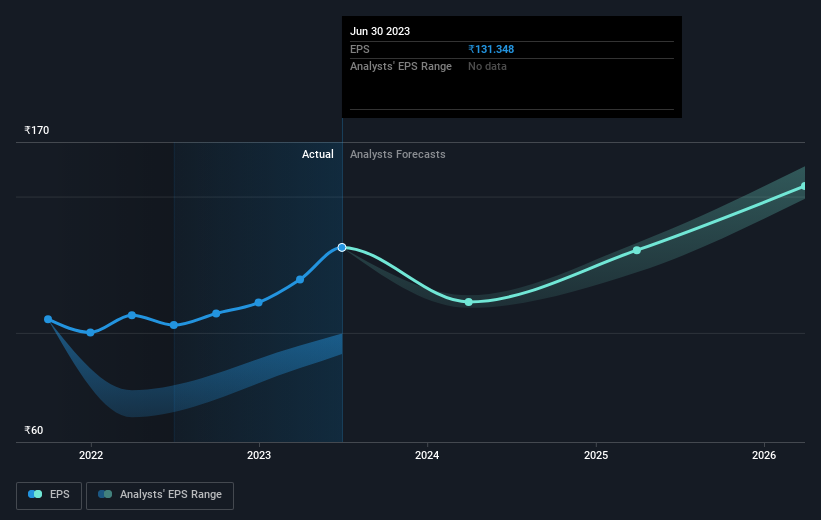
We know that Sundaram Finance has improved its bottom line lately, but is it going to grow revenue? You could check out this free report showing analyst revenue forecasts.
What About Dividends?
As well as measuring the share price return, investors should also consider the total shareholder return (TSR). The TSR is a return calculation that accounts for the value of cash dividends (assuming that any dividend received was reinvested) and the calculated value of any discounted capital raisings and spin-offs. So for companies that pay a generous dividend, the TSR is often a lot higher than the share price return. In the case of Sundaram Finance, it has a TSR of 160% for the last 3 years. That exceeds its share price return that we previously mentioned. This is largely a result of its dividend payments!
A Different Perspective
We're pleased to report that Sundaram Finance shareholders have received a total shareholder return of 51% over one year. Of course, that includes the dividend. Since the one-year TSR is better than the five-year TSR (the latter coming in at 20% per year), it would seem that the stock's performance has improved in recent times. Someone with an optimistic perspective could view the recent improvement in TSR as indicating that the business itself is getting better with time. I find it very interesting to look at share price over the long term as a proxy for business performance. But to truly gain insight, we need to consider other information, too. To that end, you should learn about the 2 warning signs we've spotted with Sundaram Finance (including 1 which is potentially serious) .
But note: Sundaram Finance may not be the best stock to buy. So take a peek at this free list of interesting companies with past earnings growth (and further growth forecast).
Please note, the market returns quoted in this article reflect the market weighted average returns of stocks that currently trade on Indian exchanges.
Valuation is complex, but we're helping make it simple.
Find out whether Sundaram Finance is potentially over or undervalued by checking out our comprehensive analysis, which includes fair value estimates, risks and warnings, dividends, insider transactions and financial health.
View the Free AnalysisHave feedback on this article? Concerned about the content? Get in touch with us directly. Alternatively, email editorial-team (at) simplywallst.com.
This article by Simply Wall St is general in nature. We provide commentary based on historical data and analyst forecasts only using an unbiased methodology and our articles are not intended to be financial advice. It does not constitute a recommendation to buy or sell any stock, and does not take account of your objectives, or your financial situation. We aim to bring you long-term focused analysis driven by fundamental data. Note that our analysis may not factor in the latest price-sensitive company announcements or qualitative material. Simply Wall St has no position in any stocks mentioned.
About NSEI:SUNDARMFIN
Sundaram Finance
Sundaram Finance Limited provides a range of financial services in India.
Proven track record second-rate dividend payer.

