
Advertisement
- India
- /
- Capital Markets
- /
- NSEI:BLBLIMITED
Not Many Are Piling Into BLB Limited (NSE:BLBLIMITED) Stock Yet As It Plummets 45%
BLB Limited (NSE:BLBLIMITED) shares have had a horrible month, losing 45% after a relatively good period beforehand. Longer-term shareholders would now have taken a real hit with the stock declining 7.9% in the last year.
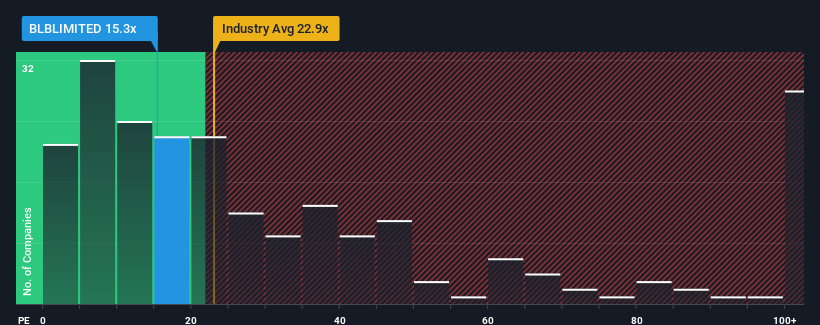
After such a large drop in price, given about half the companies in India have price-to-earnings ratios (or "P/E's") above 32x, you may consider BLB as a highly attractive investment with its 15.3x P/E ratio. However, the P/E might be quite low for a reason and it requires further investigation to determine if it's justified.
With earnings growth that's exceedingly strong of late, BLB has been doing very well. It might be that many expect the strong earnings performance to degrade substantially, which has repressed the P/E. If you like the company, you'd be hoping this isn't the case so that you could potentially pick up some stock while it's out of favour.
Check out our latest analysis for BLB
What Are Growth Metrics Telling Us About The Low P/E?
BLB's P/E ratio would be typical for a company that's expected to deliver very poor growth or even falling earnings, and importantly, perform much worse than the market.
If we review the last year of earnings growth, the company posted a terrific increase of 45%. The latest three year period has also seen an excellent 942% overall rise in EPS, aided by its short-term performance. Accordingly, shareholders would have probably welcomed those medium-term rates of earnings growth.
Weighing that recent medium-term earnings trajectory against the broader market's one-year forecast for expansion of 24% shows it's noticeably more attractive on an annualised basis.
With this information, we find it odd that BLB is trading at a P/E lower than the market. Apparently some shareholders believe the recent performance has exceeded its limits and have been accepting significantly lower selling prices.
What We Can Learn From BLB's P/E?
BLB's P/E looks about as weak as its stock price lately. We'd say the price-to-earnings ratio's power isn't primarily as a valuation instrument but rather to gauge current investor sentiment and future expectations.
We've established that BLB currently trades on a much lower than expected P/E since its recent three-year growth is higher than the wider market forecast. When we see strong earnings with faster-than-market growth, we assume potential risks are what might be placing significant pressure on the P/E ratio. It appears many are indeed anticipating earnings instability, because the persistence of these recent medium-term conditions would normally provide a boost to the share price.
Having said that, be aware BLB is showing 2 warning signs in our investment analysis, you should know about.
It's important to make sure you look for a great company, not just the first idea you come across. So take a peek at this free list of interesting companies with strong recent earnings growth (and a low P/E).
Valuation is complex, but we're here to simplify it.
Discover if BLB might be undervalued or overvalued with our detailed analysis, featuring fair value estimates, potential risks, dividends, insider trades, and its financial condition.
Access Free AnalysisHave feedback on this article? Concerned about the content? Get in touch with us directly. Alternatively, email editorial-team (at) simplywallst.com.
This article by Simply Wall St is general in nature. We provide commentary based on historical data and analyst forecasts only using an unbiased methodology and our articles are not intended to be financial advice. It does not constitute a recommendation to buy or sell any stock, and does not take account of your objectives, or your financial situation. We aim to bring you long-term focused analysis driven by fundamental data. Note that our analysis may not factor in the latest price-sensitive company announcements or qualitative material. Simply Wall St has no position in any stocks mentioned.
About NSEI:BLBLIMITED
BLB
Engages in trading and investments in shares, and securities and commodities in India.
Adequate balance sheet with acceptable track record.
Market Insights

Advertisement
Community Narratives
The company that turned a verb into a global necessity and basically runs the modern internet, digital ads, smartphones, maps, and AI.
Fair Value US$300.00|6.2% undervalued
OS
Community Contributor
Flowers Foods Pays A Fair Price For Health
Fair Value US$16.12|26.0% undervalued
NV
Community Contributor
TMX Group will thrive with 33.3% profit margin and enduring market moat
Fair Value CA$49.90|3.7% overvalued
LI
Community Contributor