
Advertisement
Investors Shouldn't Overlook The Favourable Returns On Capital At Sky Gold (NSE:SKYGOLD)
What are the early trends we should look for to identify a stock that could multiply in value over the long term? In a perfect world, we'd like to see a company investing more capital into its business and ideally the returns earned from that capital are also increasing. This shows us that it's a compounding machine, able to continually reinvest its earnings back into the business and generate higher returns. So, when we ran our eye over Sky Gold's (NSE:SKYGOLD) trend of ROCE, we really liked what we saw.
Understanding Return On Capital Employed (ROCE)
For those who don't know, ROCE is a measure of a company's yearly pre-tax profit (its return), relative to the capital employed in the business. To calculate this metric for Sky Gold, this is the formula:
Return on Capital Employed = Earnings Before Interest and Tax (EBIT) ÷ (Total Assets - Current Liabilities)
0.26 = ₹709m ÷ (₹5.9b - ₹3.1b) (Based on the trailing twelve months to March 2024).
Thus, Sky Gold has an ROCE of 26%. In absolute terms that's a great return and it's even better than the Luxury industry average of 10%.
See our latest analysis for Sky Gold
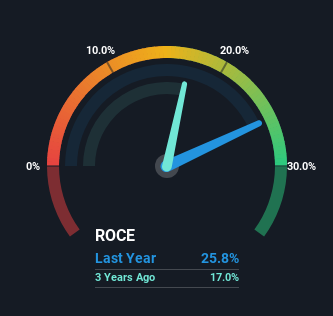
Historical performance is a great place to start when researching a stock so above you can see the gauge for Sky Gold's ROCE against it's prior returns. If you'd like to look at how Sky Gold has performed in the past in other metrics, you can view this free graph of Sky Gold's past earnings, revenue and cash flow.
The Trend Of ROCE
We'd be pretty happy with returns on capital like Sky Gold. Over the past five years, ROCE has remained relatively flat at around 26% and the business has deployed 554% more capital into its operations. Returns like this are the envy of most businesses and given it has repeatedly reinvested at these rates, that's even better. You'll see this when looking at well operated businesses or favorable business models.
On a separate but related note, it's important to know that Sky Gold has a current liabilities to total assets ratio of 53%, which we'd consider pretty high. This can bring about some risks because the company is basically operating with a rather large reliance on its suppliers or other sorts of short-term creditors. Ideally we'd like to see this reduce as that would mean fewer obligations bearing risks.
The Key Takeaway
Sky Gold has demonstrated its proficiency by generating high returns on increasing amounts of capital employed, which we're thrilled about. And the stock has done incredibly well with a 638% return over the last year, so long term investors are no doubt ecstatic with that result. So while investors seem to be recognizing these promising trends, we still believe the stock deserves further research.
If you'd like to know more about Sky Gold, we've spotted 4 warning signs, and 2 of them are a bit unpleasant.
If you want to search for more stocks that have been earning high returns, check out this free list of stocks with solid balance sheets that are also earning high returns on equity.
New: Manage All Your Stock Portfolios in One Place
We've created the ultimate portfolio companion for stock investors, and it's free.
• Connect an unlimited number of Portfolios and see your total in one currency
• Be alerted to new Warning Signs or Risks via email or mobile
• Track the Fair Value of your stocks
Have feedback on this article? Concerned about the content? Get in touch with us directly. Alternatively, email editorial-team (at) simplywallst.com.
This article by Simply Wall St is general in nature. We provide commentary based on historical data and analyst forecasts only using an unbiased methodology and our articles are not intended to be financial advice. It does not constitute a recommendation to buy or sell any stock, and does not take account of your objectives, or your financial situation. We aim to bring you long-term focused analysis driven by fundamental data. Note that our analysis may not factor in the latest price-sensitive company announcements or qualitative material. Simply Wall St has no position in any stocks mentioned.
Have feedback on this article? Concerned about the content? Get in touch with us directly. Alternatively, email editorial-team@simplywallst.com
About NSEI:SKYGOLD
Sky Gold and Diamonds
Designs, manufactures, assembles, cuts, polishes, markets, and sells gold and silver jewelry in India.
Exceptional growth potential with proven track record.
Similar Companies
Market Insights

Advertisement
Weekly Picks
FA

FAI on Arabian Internet and Communication Services ·
Solutions by stc: 34% Upside in Saudi's Digital Transformation Leader
Fair Value:ر.س342.2335.7% undervalued
9 followersusers have followed this narrative
1 commentusers have commented on this narrative
3 likesusers have liked this narrative
RO


RobertoAllende on NVIDIA ·
The AI Infrastructure Giant Grows Into Its Valuation
Fair Value:US$345.0747.9% undervalued
27 followersusers have followed this narrative
28 commentsusers have commented on this narrative
21 likesusers have liked this narrative
Recently Updated Narratives
TA


Talos on PayPal Holdings ·
The "Sleeping Giant" Wakes Up – Efficiency & Monetization
Fair Value:US$174.9264.2% undervalued
1 followerusers have followed this narrative
0 commentsusers have commented on this narrative
0 likesusers have liked this narrative
TA

Talos on Pagaya Technologies ·
The "Rate Cut" Supercycle Winner – Profitable & Accelerating
Fair Value:US$170.685.9% undervalued
1 followerusers have followed this narrative
0 commentsusers have commented on this narrative
0 likesusers have liked this narrative
TA

Talos on Archer Aviation ·
The Industrialist of the Skies – Scaling with "Automotive DNA
Fair Value:US$16.3254.3% undervalued
1 followerusers have followed this narrative
0 commentsusers have commented on this narrative
0 likesusers have liked this narrative
Popular Narratives
TH


TheWallstreetKing on MicroVision ·
MicroVision will explode future revenue by 380.37% with a vision towards success
Fair Value:US$6098.6% undervalued
110 followersusers have followed this narrative
11 commentsusers have commented on this narrative
22 likesusers have liked this narrative
AN

AnalystConsensusTarget on NVIDIA ·
NVDA: Expanding AI Demand Will Drive Major Data Center Investments Through 2026
Fair Value:US$250.3928.1% undervalued
945 followersusers have followed this narrative
6 commentsusers have commented on this narrative
24 likesusers have liked this narrative
OS


oscargarcia on Alphabet ·
The company that turned a verb into a global necessity and basically runs the modern internet, digital ads, smartphones, maps, and AI.
Fair Value:US$3407.4% undervalued
146 followersusers have followed this narrative
6 commentsusers have commented on this narrative
18 likesusers have liked this narrative