
Advertisement
Risks To Shareholder Returns Are Elevated At These Prices For Shiva Texyarn Limited (NSE:SHIVATEX)
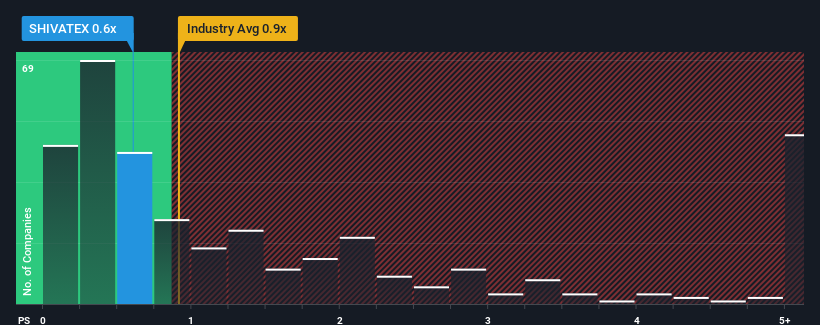
With a median price-to-sales (or "P/S") ratio of close to 0.9x in the Luxury industry in India, you could be forgiven for feeling indifferent about Shiva Texyarn Limited's (NSE:SHIVATEX) P/S ratio of 0.6x. However, investors might be overlooking a clear opportunity or potential setback if there is no rational basis for the P/S.
See our latest analysis for Shiva Texyarn
What Does Shiva Texyarn's P/S Mean For Shareholders?
For instance, Shiva Texyarn's receding revenue in recent times would have to be some food for thought. One possibility is that the P/S is moderate because investors think the company might still do enough to be in line with the broader industry in the near future. If you like the company, you'd at least be hoping this is the case so that you could potentially pick up some stock while it's not quite in favour.
Although there are no analyst estimates available for Shiva Texyarn, take a look at this free data-rich visualisation to see how the company stacks up on earnings, revenue and cash flow.Is There Some Revenue Growth Forecasted For Shiva Texyarn?
Shiva Texyarn's P/S ratio would be typical for a company that's only expected to deliver moderate growth, and importantly, perform in line with the industry.
Taking a look back first, the company's revenue growth last year wasn't something to get excited about as it posted a disappointing decline of 18%. This has soured the latest three-year period, which nevertheless managed to deliver a decent 13% overall rise in revenue. So we can start by confirming that the company has generally done a good job of growing revenue over that time, even though it had some hiccups along the way.
This is in contrast to the rest of the industry, which is expected to grow by 11% over the next year, materially higher than the company's recent medium-term annualised growth rates.
With this information, we find it interesting that Shiva Texyarn is trading at a fairly similar P/S compared to the industry. Apparently many investors in the company are less bearish than recent times would indicate and aren't willing to let go of their stock right now. Maintaining these prices will be difficult to achieve as a continuation of recent revenue trends is likely to weigh down the shares eventually.
What We Can Learn From Shiva Texyarn's P/S?
We'd say the price-to-sales ratio's power isn't primarily as a valuation instrument but rather to gauge current investor sentiment and future expectations.
We've established that Shiva Texyarn's average P/S is a bit surprising since its recent three-year growth is lower than the wider industry forecast. When we see weak revenue with slower than industry growth, we suspect the share price is at risk of declining, bringing the P/S back in line with expectations. Unless the recent medium-term conditions improve, it's hard to accept the current share price as fair value.
Before you take the next step, you should know about the 3 warning signs for Shiva Texyarn (2 are concerning!) that we have uncovered.
If you're unsure about the strength of Shiva Texyarn's business, why not explore our interactive list of stocks with solid business fundamentals for some other companies you may have missed.
New: Manage All Your Stock Portfolios in One Place
We've created the ultimate portfolio companion for stock investors, and it's free.
• Connect an unlimited number of Portfolios and see your total in one currency
• Be alerted to new Warning Signs or Risks via email or mobile
• Track the Fair Value of your stocks
Have feedback on this article? Concerned about the content? Get in touch with us directly. Alternatively, email editorial-team (at) simplywallst.com.
This article by Simply Wall St is general in nature. We provide commentary based on historical data and analyst forecasts only using an unbiased methodology and our articles are not intended to be financial advice. It does not constitute a recommendation to buy or sell any stock, and does not take account of your objectives, or your financial situation. We aim to bring you long-term focused analysis driven by fundamental data. Note that our analysis may not factor in the latest price-sensitive company announcements or qualitative material. Simply Wall St has no position in any stocks mentioned.
About NSEI:SHIVATEX
Shiva Texyarn
Manufactures and sells yarn, coated and laminated fabrics, garments, and other value added products in India and internationally.
Slight risk with mediocre balance sheet.
Similar Companies
Market Insights

Advertisement
Community Narratives
The company that turned a verb into a global necessity and basically runs the modern internet, digital ads, smartphones, maps, and AI.
Fair Value US$300.00|7.5% undervalued
OS
Community Contributor
Flowers Foods Pays A Fair Price For Health
Fair Value US$16.12|25.4% undervalued
NV
Community Contributor
TMX Group will thrive with 33.3% profit margin and enduring market moat
Fair Value CA$49.90|3.6% overvalued
LI
Community Contributor
The "Molecular Pencil": Why Beam's Technology is Built to Win
Fair Value US$65.01|65.0% undervalued
DA
Community Contributor