
Advertisement
Sangam (India) (NSE:SANGAMIND) Is Looking To Continue Growing Its Returns On Capital
What are the early trends we should look for to identify a stock that could multiply in value over the long term? Ideally, a business will show two trends; firstly a growing return on capital employed (ROCE) and secondly, an increasing amount of capital employed. Ultimately, this demonstrates that it's a business that is reinvesting profits at increasing rates of return. So when we looked at Sangam (India) (NSE:SANGAMIND) and its trend of ROCE, we really liked what we saw.
Return On Capital Employed (ROCE): What Is It?
Just to clarify if you're unsure, ROCE is a metric for evaluating how much pre-tax income (in percentage terms) a company earns on the capital invested in its business. To calculate this metric for Sangam (India), this is the formula:
Return on Capital Employed = Earnings Before Interest and Tax (EBIT) ÷ (Total Assets - Current Liabilities)
0.14 = ₹1.8b ÷ (₹22b - ₹8.9b) (Based on the trailing twelve months to June 2023).
So, Sangam (India) has an ROCE of 14%. In absolute terms, that's a satisfactory return, but compared to the Luxury industry average of 10% it's much better.
View our latest analysis for Sangam (India)
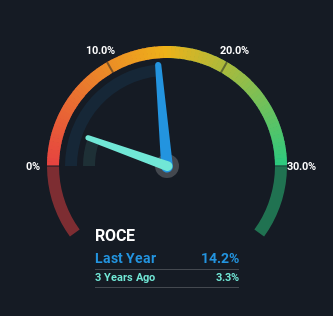
Historical performance is a great place to start when researching a stock so above you can see the gauge for Sangam (India)'s ROCE against it's prior returns. If you're interested in investigating Sangam (India)'s past further, check out this free graph of past earnings, revenue and cash flow.
The Trend Of ROCE
Sangam (India) is displaying some positive trends. The data shows that returns on capital have increased substantially over the last five years to 14%. The company is effectively making more money per dollar of capital used, and it's worth noting that the amount of capital has increased too, by 41%. This can indicate that there's plenty of opportunities to invest capital internally and at ever higher rates, a combination that's common among multi-baggers.
On a side note, Sangam (India)'s current liabilities are still rather high at 41% of total assets. This effectively means that suppliers (or short-term creditors) are funding a large portion of the business, so just be aware that this can introduce some elements of risk. Ideally we'd like to see this reduce as that would mean fewer obligations bearing risks.
The Key Takeaway
To sum it up, Sangam (India) has proven it can reinvest in the business and generate higher returns on that capital employed, which is terrific. And with the stock having performed exceptionally well over the last five years, these patterns are being accounted for by investors. Therefore, we think it would be worth your time to check if these trends are going to continue.
If you want to continue researching Sangam (India), you might be interested to know about the 4 warning signs that our analysis has discovered.
While Sangam (India) may not currently earn the highest returns, we've compiled a list of companies that currently earn more than 25% return on equity. Check out this free list here.
New: Manage All Your Stock Portfolios in One Place
We've created the ultimate portfolio companion for stock investors, and it's free.
• Connect an unlimited number of Portfolios and see your total in one currency
• Be alerted to new Warning Signs or Risks via email or mobile
• Track the Fair Value of your stocks
Have feedback on this article? Concerned about the content? Get in touch with us directly. Alternatively, email editorial-team (at) simplywallst.com.
This article by Simply Wall St is general in nature. We provide commentary based on historical data and analyst forecasts only using an unbiased methodology and our articles are not intended to be financial advice. It does not constitute a recommendation to buy or sell any stock, and does not take account of your objectives, or your financial situation. We aim to bring you long-term focused analysis driven by fundamental data. Note that our analysis may not factor in the latest price-sensitive company announcements or qualitative material. Simply Wall St has no position in any stocks mentioned.
About NSEI:SANGAMIND
Sangam (India)
Manufactures and sells PV-dyed yarns and denim fabrics in India.
Adequate balance sheet second-rate dividend payer.
Similar Companies
Market Insights

Advertisement
Community Narratives
The company that turned a verb into a global necessity and basically runs the modern internet, digital ads, smartphones, maps, and AI.
Fair Value US$300.00|6.2% undervalued
OS
Community Contributor
Flowers Foods Pays A Fair Price For Health
Fair Value US$16.12|25.1% undervalued
NV
Community Contributor
TMX Group will thrive with 33.3% profit margin and enduring market moat
Fair Value CA$49.90|0.04% overvalued
LI
Community Contributor