
Advertisement
Pasupati Acrylon Limited's (NSE:PASUPTAC) Stock Is Rallying But Financials Look Ambiguous: Will The Momentum Continue?
Pasupati Acrylon (NSE:PASUPTAC) has had a great run on the share market with its stock up by a significant 58% over the last three months. But the company's key financial indicators appear to be differing across the board and that makes us question whether or not the company's current share price momentum can be maintained. Particularly, we will be paying attention to Pasupati Acrylon's ROE today.
Return on Equity or ROE is a test of how effectively a company is growing its value and managing investors’ money. Put another way, it reveals the company's success at turning shareholder investments into profits.
Check out our latest analysis for Pasupati Acrylon
How To Calculate Return On Equity?
Return on equity can be calculated by using the formula:
Return on Equity = Net Profit (from continuing operations) ÷ Shareholders' Equity
So, based on the above formula, the ROE for Pasupati Acrylon is:
7.1% = ₹232m ÷ ₹3.3b (Based on the trailing twelve months to June 2024).
The 'return' is the amount earned after tax over the last twelve months. That means that for every ₹1 worth of shareholders' equity, the company generated ₹0.07 in profit.
What Is The Relationship Between ROE And Earnings Growth?
So far, we've learned that ROE is a measure of a company's profitability. Depending on how much of these profits the company reinvests or "retains", and how effectively it does so, we are then able to assess a company’s earnings growth potential. Assuming everything else remains unchanged, the higher the ROE and profit retention, the higher the growth rate of a company compared to companies that don't necessarily bear these characteristics.
Pasupati Acrylon's Earnings Growth And 7.1% ROE
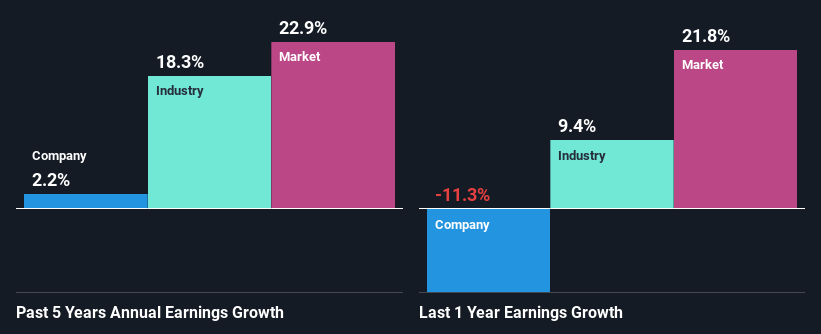
It is hard to argue that Pasupati Acrylon's ROE is much good in and of itself. An industry comparison shows that the company's ROE is not much different from the industry average of 7.7% either. Thus, the low ROE certainly provides some context to Pasupati Acrylon's very little net income growth of 2.2% seen over the past five years.
As a next step, we compared Pasupati Acrylon's net income growth with the industry and were disappointed to see that the company's growth is lower than the industry average growth of 18% in the same period.
Earnings growth is an important metric to consider when valuing a stock. The investor should try to establish if the expected growth or decline in earnings, whichever the case may be, is priced in. This then helps them determine if the stock is placed for a bright or bleak future. One good indicator of expected earnings growth is the P/E ratio which determines the price the market is willing to pay for a stock based on its earnings prospects. So, you may want to check if Pasupati Acrylon is trading on a high P/E or a low P/E, relative to its industry.
Is Pasupati Acrylon Using Its Retained Earnings Effectively?
Pasupati Acrylon doesn't pay any regular dividends, meaning that potentially all of its profits are being reinvested in the business. However, this doesn't explain the low earnings growth the company has seen. Therefore, there might be some other reasons to explain the lack in that respect. For example, the business could be in decline.
Summary
Overall, we have mixed feelings about Pasupati Acrylon. While the company does have a high rate of profit retention, its low rate of return is probably hampering its earnings growth. Wrapping up, we would proceed with caution with this company and one way of doing that would be to look at the risk profile of the business. To know the 2 risks we have identified for Pasupati Acrylon visit our risks dashboard for free.
New: Manage All Your Stock Portfolios in One Place
We've created the ultimate portfolio companion for stock investors, and it's free.
• Connect an unlimited number of Portfolios and see your total in one currency
• Be alerted to new Warning Signs or Risks via email or mobile
• Track the Fair Value of your stocks
Have feedback on this article? Concerned about the content? Get in touch with us directly. Alternatively, email editorial-team (at) simplywallst.com.
This article by Simply Wall St is general in nature. We provide commentary based on historical data and analyst forecasts only using an unbiased methodology and our articles are not intended to be financial advice. It does not constitute a recommendation to buy or sell any stock, and does not take account of your objectives, or your financial situation. We aim to bring you long-term focused analysis driven by fundamental data. Note that our analysis may not factor in the latest price-sensitive company announcements or qualitative material. Simply Wall St has no position in any stocks mentioned.
About NSEI:PASUPTAC
Pasupati Acrylon
Manufactures and sells acrylic fibers, cast polypropylene (CPP) films in India.
Adequate balance sheet with acceptable track record.
Market Insights

Advertisement
Community Narratives
The company that turned a verb into a global necessity and basically runs the modern internet, digital ads, smartphones, maps, and AI.
Fair Value US$300.00|6.2% undervalued
OS
Community Contributor
Flowers Foods Pays A Fair Price For Health
Fair Value US$16.12|25.1% undervalued
NV
Community Contributor
TMX Group will thrive with 33.3% profit margin and enduring market moat
Fair Value CA$49.90|0.04% overvalued
LI
Community Contributor