
Advertisement
Return Trends At Manomay Tex India (NSE:MANOMAY) Aren't Appealing
Finding a business that has the potential to grow substantially is not easy, but it is possible if we look at a few key financial metrics. Ideally, a business will show two trends; firstly a growing return on capital employed (ROCE) and secondly, an increasing amount of capital employed. Basically this means that a company has profitable initiatives that it can continue to reinvest in, which is a trait of a compounding machine. That's why when we briefly looked at Manomay Tex India's (NSE:MANOMAY) ROCE trend, we were pretty happy with what we saw.
Understanding Return On Capital Employed (ROCE)
If you haven't worked with ROCE before, it measures the 'return' (pre-tax profit) a company generates from capital employed in its business. To calculate this metric for Manomay Tex India, this is the formula:
Return on Capital Employed = Earnings Before Interest and Tax (EBIT) ÷ (Total Assets - Current Liabilities)
0.13 = ₹313m ÷ (₹4.5b - ₹2.1b) (Based on the trailing twelve months to December 2023).
Therefore, Manomay Tex India has an ROCE of 13%. That's a relatively normal return on capital, and it's around the 11% generated by the Luxury industry.
See our latest analysis for Manomay Tex India
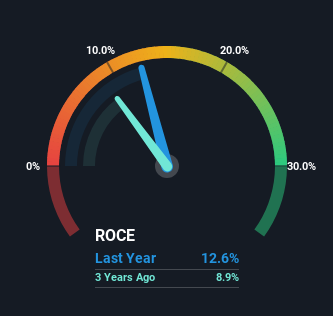
Historical performance is a great place to start when researching a stock so above you can see the gauge for Manomay Tex India's ROCE against it's prior returns. If you're interested in investigating Manomay Tex India's past further, check out this free graph covering Manomay Tex India's past earnings, revenue and cash flow.
How Are Returns Trending?
The trend of ROCE doesn't stand out much, but returns on a whole are decent. Over the past five years, ROCE has remained relatively flat at around 13% and the business has deployed 162% more capital into its operations. Since 13% is a moderate ROCE though, it's good to see a business can continue to reinvest at these decent rates of return. Over long periods of time, returns like these might not be too exciting, but with consistency they can pay off in terms of share price returns.
On a separate but related note, it's important to know that Manomay Tex India has a current liabilities to total assets ratio of 45%, which we'd consider pretty high. This effectively means that suppliers (or short-term creditors) are funding a large portion of the business, so just be aware that this can introduce some elements of risk. Ideally we'd like to see this reduce as that would mean fewer obligations bearing risks.
Our Take On Manomay Tex India's ROCE
The main thing to remember is that Manomay Tex India has proven its ability to continually reinvest at respectable rates of return. And since the stock has risen strongly over the last year, it appears the market might expect this trend to continue. So while investors seem to be recognizing these promising trends, we still believe the stock deserves further research.
If you want to know some of the risks facing Manomay Tex India we've found 3 warning signs (1 is concerning!) that you should be aware of before investing here.
For those who like to invest in solid companies, check out this free list of companies with solid balance sheets and high returns on equity.
New: Manage All Your Stock Portfolios in One Place
We've created the ultimate portfolio companion for stock investors, and it's free.
• Connect an unlimited number of Portfolios and see your total in one currency
• Be alerted to new Warning Signs or Risks via email or mobile
• Track the Fair Value of your stocks
Have feedback on this article? Concerned about the content? Get in touch with us directly. Alternatively, email editorial-team (at) simplywallst.com.
This article by Simply Wall St is general in nature. We provide commentary based on historical data and analyst forecasts only using an unbiased methodology and our articles are not intended to be financial advice. It does not constitute a recommendation to buy or sell any stock, and does not take account of your objectives, or your financial situation. We aim to bring you long-term focused analysis driven by fundamental data. Note that our analysis may not factor in the latest price-sensitive company announcements or qualitative material. Simply Wall St has no position in any stocks mentioned.
About NSEI:MANOMAY
Manomay Tex India
Manufactures and sells denims and denim fabrics in India and internationally.
Acceptable track record with imperfect balance sheet.
Similar Companies
Market Insights

Advertisement
Community Narratives
The company that turned a verb into a global necessity and basically runs the modern internet, digital ads, smartphones, maps, and AI.
Fair Value US$300.00|6.3% undervalued
OS
Community Contributor
Flowers Foods Pays A Fair Price For Health
Fair Value US$16.12|26.0% undervalued
NV
Community Contributor
TMX Group will thrive with 33.3% profit margin and enduring market moat
Fair Value CA$49.90|3.7% overvalued
LI
Community Contributor