K.P.R. Mill (NSE:KPRMILL) jumps 6.7% this week, though earnings growth is still tracking behind five-year shareholder returns


We think all investors should try to buy and hold high quality multi-year winners. And highest quality companies can see their share prices grow by huge amounts. Don't believe it? Then look at the K.P.R. Mill Limited (NSE:KPRMILL) share price. It's 598% higher than it was five years ago. If that doesn't get you thinking about long term investing, we don't know what will. Also pleasing for shareholders was the 20% gain in the last three months. This could be related to the recent financial results, released recently - you can catch up on the most recent data by reading our company report. We love happy stories like this one. The company should be really proud of that performance!
After a strong gain in the past week, it's worth seeing if longer term returns have been driven by improving fundamentals.
View our latest analysis for K.P.R. Mill
To paraphrase Benjamin Graham: Over the short term the market is a voting machine, but over the long term it's a weighing machine. By comparing earnings per share (EPS) and share price changes over time, we can get a feel for how investor attitudes to a company have morphed over time.
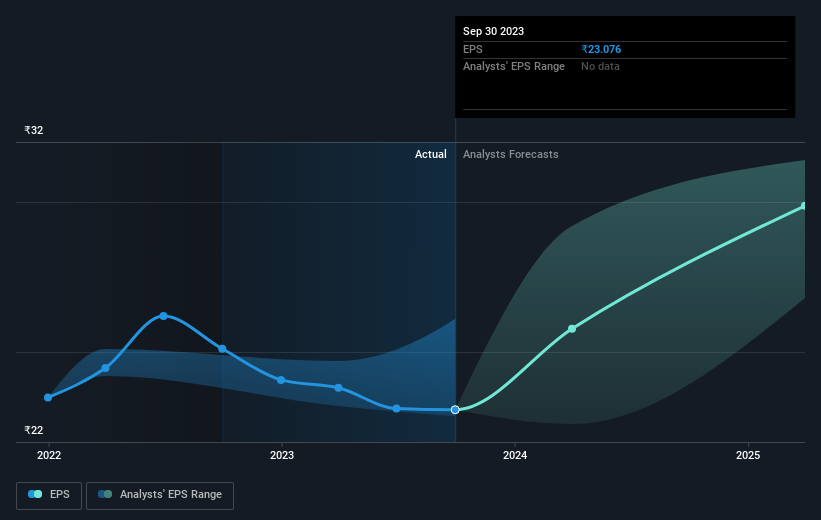
During five years of share price growth, K.P.R. Mill achieved compound earnings per share (EPS) growth of 22% per year. This EPS growth is lower than the 47% average annual increase in the share price. So it's fair to assume the market has a higher opinion of the business than it did five years ago. That's not necessarily surprising considering the five-year track record of earnings growth.
You can see below how EPS has changed over time (discover the exact values by clicking on the image).
It is of course excellent to see how K.P.R. Mill has grown profits over the years, but the future is more important for shareholders. You can see how its balance sheet has strengthened (or weakened) over time in this free interactive graphic.
What About Dividends?
It is important to consider the total shareholder return, as well as the share price return, for any given stock. Whereas the share price return only reflects the change in the share price, the TSR includes the value of dividends (assuming they were reinvested) and the benefit of any discounted capital raising or spin-off. Arguably, the TSR gives a more comprehensive picture of the return generated by a stock. We note that for K.P.R. Mill the TSR over the last 5 years was 611%, which is better than the share price return mentioned above. This is largely a result of its dividend payments!
A Different Perspective
It's good to see that K.P.R. Mill has rewarded shareholders with a total shareholder return of 46% in the last twelve months. That's including the dividend. However, the TSR over five years, coming in at 48% per year, is even more impressive. While it is well worth considering the different impacts that market conditions can have on the share price, there are other factors that are even more important. Take risks, for example - K.P.R. Mill has 1 warning sign we think you should be aware of.
If you would prefer to check out another company -- one with potentially superior financials -- then do not miss this free list of companies that have proven they can grow earnings.
Please note, the market returns quoted in this article reflect the market weighted average returns of stocks that currently trade on Indian exchanges.
Valuation is complex, but we're here to simplify it.
Discover if K.P.R. Mill might be undervalued or overvalued with our detailed analysis, featuring fair value estimates, potential risks, dividends, insider trades, and its financial condition.
Access Free AnalysisHave feedback on this article? Concerned about the content? Get in touch with us directly. Alternatively, email editorial-team (at) simplywallst.com.
This article by Simply Wall St is general in nature. We provide commentary based on historical data and analyst forecasts only using an unbiased methodology and our articles are not intended to be financial advice. It does not constitute a recommendation to buy or sell any stock, and does not take account of your objectives, or your financial situation. We aim to bring you long-term focused analysis driven by fundamental data. Note that our analysis may not factor in the latest price-sensitive company announcements or qualitative material. Simply Wall St has no position in any stocks mentioned.
About NSEI:KPRMILL
K.P.R. Mill
Operates as an integrated apparel manufacturing company in India and internationally.
Flawless balance sheet average dividend payer.

