
Advertisement
Calculating The Fair Value Of Eurotex Industries and Exports Limited (NSE:EUROTEXIND)
Key Insights
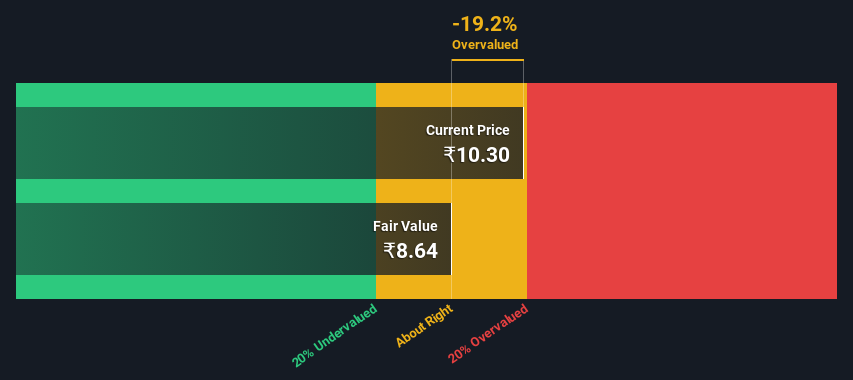
- Using the 2 Stage Free Cash Flow to Equity, Eurotex Industries and Exports fair value estimate is ₹8.64
- Current share price of ₹10.30 suggests Eurotex Industries and Exports is potentially trading close to its fair value
- Industry average of 1,536% suggests Eurotex Industries and Exports' peers are currently trading at a higher premium to fair value
Does the October share price for Eurotex Industries and Exports Limited (NSE:EUROTEXIND) reflect what it's really worth? Today, we will estimate the stock's intrinsic value by estimating the company's future cash flows and discounting them to their present value. We will use the Discounted Cash Flow (DCF) model on this occasion. Don't get put off by the jargon, the math behind it is actually quite straightforward.
We generally believe that a company's value is the present value of all of the cash it will generate in the future. However, a DCF is just one valuation metric among many, and it is not without flaws. If you want to learn more about discounted cash flow, the rationale behind this calculation can be read in detail in the Simply Wall St analysis model.
View our latest analysis for Eurotex Industries and Exports
The Model
We are going to use a two-stage DCF model, which, as the name states, takes into account two stages of growth. The first stage is generally a higher growth period which levels off heading towards the terminal value, captured in the second 'steady growth' period. To begin with, we have to get estimates of the next ten years of cash flows. Seeing as no analyst estimates of free cash flow are available to us, we have extrapolate the previous free cash flow (FCF) from the company's last reported value. We assume companies with shrinking free cash flow will slow their rate of shrinkage, and that companies with growing free cash flow will see their growth rate slow, over this period. We do this to reflect that growth tends to slow more in the early years than it does in later years.
A DCF is all about the idea that a dollar in the future is less valuable than a dollar today, so we need to discount the sum of these future cash flows to arrive at a present value estimate:
10-year free cash flow (FCF) estimate
| 2024 | 2025 | 2026 | 2027 | 2028 | 2029 | 2030 | 2031 | 2032 | 2033 | |
| Levered FCF (₹, Millions) | ₹11.7m | ₹12.9m | ₹14.1m | ₹15.3m | ₹16.6m | ₹17.8m | ₹19.2m | ₹20.5m | ₹22.0m | ₹23.5m |
| Growth Rate Estimate Source | Est @ 12.20% | Est @ 10.57% | Est @ 9.42% | Est @ 8.62% | Est @ 8.07% | Est @ 7.67% | Est @ 7.40% | Est @ 7.21% | Est @ 7.07% | Est @ 6.98% |
| Present Value (₹, Millions) Discounted @ 23% | ₹9.5 | ₹8.5 | ₹7.5 | ₹6.6 | ₹5.8 | ₹5.0 | ₹4.4 | ₹3.8 | ₹3.3 | ₹2.9 |
("Est" = FCF growth rate estimated by Simply Wall St)
Present Value of 10-year Cash Flow (PVCF) = ₹57m
The second stage is also known as Terminal Value, this is the business's cash flow after the first stage. For a number of reasons a very conservative growth rate is used that cannot exceed that of a country's GDP growth. In this case we have used the 5-year average of the 10-year government bond yield (6.8%) to estimate future growth. In the same way as with the 10-year 'growth' period, we discount future cash flows to today's value, using a cost of equity of 23%.
Terminal Value (TV)= FCF2033 × (1 + g) ÷ (r – g) = ₹24m× (1 + 6.8%) ÷ (23%– 6.8%) = ₹151m
Present Value of Terminal Value (PVTV)= TV / (1 + r)10= ₹151m÷ ( 1 + 23%)10= ₹18m
The total value, or equity value, is then the sum of the present value of the future cash flows, which in this case is ₹76m. In the final step we divide the equity value by the number of shares outstanding. Compared to the current share price of ₹10.3, the company appears around fair value at the time of writing. Valuations are imprecise instruments though, rather like a telescope - move a few degrees and end up in a different galaxy. Do keep this in mind.
The Assumptions
Now the most important inputs to a discounted cash flow are the discount rate, and of course, the actual cash flows. You don't have to agree with these inputs, I recommend redoing the calculations yourself and playing with them. The DCF also does not consider the possible cyclicality of an industry, or a company's future capital requirements, so it does not give a full picture of a company's potential performance. Given that we are looking at Eurotex Industries and Exports as potential shareholders, the cost of equity is used as the discount rate, rather than the cost of capital (or weighted average cost of capital, WACC) which accounts for debt. In this calculation we've used 23%, which is based on a levered beta of 2.000. Beta is a measure of a stock's volatility, compared to the market as a whole. We get our beta from the industry average beta of globally comparable companies, with an imposed limit between 0.8 and 2.0, which is a reasonable range for a stable business.
SWOT Analysis for Eurotex Industries and Exports
Strength
- No major strengths identified for EUROTEXIND.
Weakness
- Current share price is above our estimate of fair value.
Opportunity
- Has sufficient cash runway for more than 3 years based on current free cash flows.
- Lack of analyst coverage makes it difficult to determine EUROTEXIND's earnings prospects.
Threat
- Debt is not well covered by operating cash flow.
- Total liabilities exceed total assets, which raises the risk of financial distress.
Moving On:
Although the valuation of a company is important, it shouldn't be the only metric you look at when researching a company. The DCF model is not a perfect stock valuation tool. Preferably you'd apply different cases and assumptions and see how they would impact the company's valuation. If a company grows at a different rate, or if its cost of equity or risk free rate changes sharply, the output can look very different. For Eurotex Industries and Exports, there are three important items you should further examine:
- Risks: We feel that you should assess the 3 warning signs for Eurotex Industries and Exports we've flagged before making an investment in the company.
- Other High Quality Alternatives: Do you like a good all-rounder? Explore our interactive list of high quality stocks to get an idea of what else is out there you may be missing!
- Other Environmentally-Friendly Companies: Concerned about the environment and think consumers will buy eco-friendly products more and more? Browse through our interactive list of companies that are thinking about a greener future to discover some stocks you may not have thought of!
PS. Simply Wall St updates its DCF calculation for every Indian stock every day, so if you want to find the intrinsic value of any other stock just search here.
Valuation is complex, but we're here to simplify it.
Discover if Eurotex Industries and Exports might be undervalued or overvalued with our detailed analysis, featuring fair value estimates, potential risks, dividends, insider trades, and its financial condition.
Access Free AnalysisHave feedback on this article? Concerned about the content? Get in touch with us directly. Alternatively, email editorial-team (at) simplywallst.com.
This article by Simply Wall St is general in nature. We provide commentary based on historical data and analyst forecasts only using an unbiased methodology and our articles are not intended to be financial advice. It does not constitute a recommendation to buy or sell any stock, and does not take account of your objectives, or your financial situation. We aim to bring you long-term focused analysis driven by fundamental data. Note that our analysis may not factor in the latest price-sensitive company announcements or qualitative material. Simply Wall St has no position in any stocks mentioned.
About NSEI:EUROTEXIND
Eurotex Industries and Exports
Primarily engages in the real estate development business in India.
Medium-low risk and slightly overvalued.
Market Insights

Advertisement
Community Narratives
MicroVision will explode future revenue by 380.37% with a vision towards success
Fair Value US$60.00|98.5% undervalued
TH
Community Contributor
The Indispensable Artery for a New North American Economy
Fair Value CA$132.87|2.3% undervalued
TI
Community Contributor