Stock Analysis
- India
- /
- Professional Services
- /
- NSEI:LTTS
L&T Technology Services (NSE:LTTS) stock performs better than its underlying earnings growth over last five years

When you buy a stock there is always a possibility that it could drop 100%. But when you pick a company that is really flourishing, you can make more than 100%. Long term L&T Technology Services Limited (NSE:LTTS) shareholders would be well aware of this, since the stock is up 244% in five years. In the last week the share price is up 4.9%.
Since the stock has added ₹27b to its market cap in the past week alone, let's see if underlying performance has been driving long-term returns.
Check out our latest analysis for L&T Technology Services
There is no denying that markets are sometimes efficient, but prices do not always reflect underlying business performance. One way to examine how market sentiment has changed over time is to look at the interaction between a company's share price and its earnings per share (EPS).
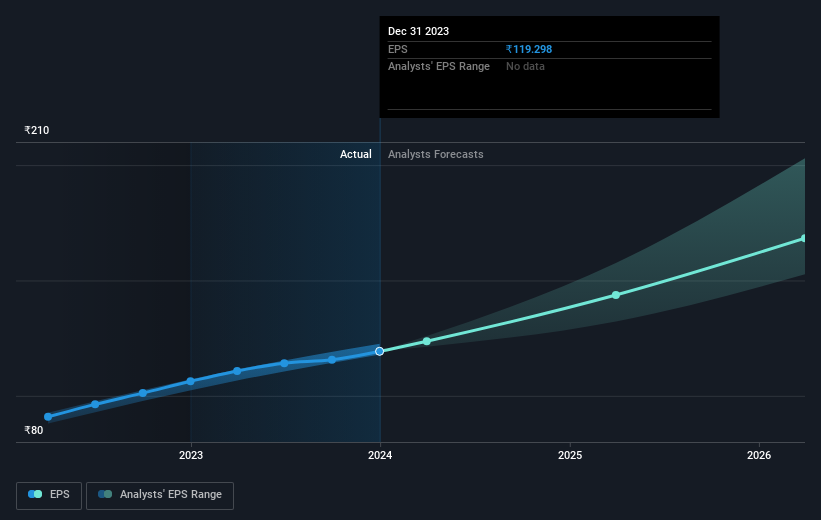
During five years of share price growth, L&T Technology Services achieved compound earnings per share (EPS) growth of 11% per year. This EPS growth is lower than the 28% average annual increase in the share price. So it's fair to assume the market has a higher opinion of the business than it did five years ago. And that's hardly shocking given the track record of growth. This optimism is visible in its fairly high P/E ratio of 45.69.
The company's earnings per share (over time) is depicted in the image below (click to see the exact numbers).
We know that L&T Technology Services has improved its bottom line lately, but is it going to grow revenue? This free report showing analyst revenue forecasts should help you figure out if the EPS growth can be sustained.
What About Dividends?
As well as measuring the share price return, investors should also consider the total shareholder return (TSR). The TSR incorporates the value of any spin-offs or discounted capital raisings, along with any dividends, based on the assumption that the dividends are reinvested. Arguably, the TSR gives a more comprehensive picture of the return generated by a stock. In the case of L&T Technology Services, it has a TSR of 265% for the last 5 years. That exceeds its share price return that we previously mentioned. And there's no prize for guessing that the dividend payments largely explain the divergence!
A Different Perspective
It's good to see that L&T Technology Services has rewarded shareholders with a total shareholder return of 64% in the last twelve months. Of course, that includes the dividend. That gain is better than the annual TSR over five years, which is 30%. Therefore it seems like sentiment around the company has been positive lately. Someone with an optimistic perspective could view the recent improvement in TSR as indicating that the business itself is getting better with time. It's always interesting to track share price performance over the longer term. But to understand L&T Technology Services better, we need to consider many other factors. Even so, be aware that L&T Technology Services is showing 2 warning signs in our investment analysis , you should know about...
If you are like me, then you will not want to miss this free list of growing companies that insiders are buying.
Please note, the market returns quoted in this article reflect the market weighted average returns of stocks that currently trade on Indian exchanges.
Valuation is complex, but we're helping make it simple.
Find out whether L&T Technology Services is potentially over or undervalued by checking out our comprehensive analysis, which includes fair value estimates, risks and warnings, dividends, insider transactions and financial health.
View the Free AnalysisHave feedback on this article? Concerned about the content? Get in touch with us directly. Alternatively, email editorial-team (at) simplywallst.com.
This article by Simply Wall St is general in nature. We provide commentary based on historical data and analyst forecasts only using an unbiased methodology and our articles are not intended to be financial advice. It does not constitute a recommendation to buy or sell any stock, and does not take account of your objectives, or your financial situation. We aim to bring you long-term focused analysis driven by fundamental data. Note that our analysis may not factor in the latest price-sensitive company announcements or qualitative material. Simply Wall St has no position in any stocks mentioned.
About NSEI:LTTS
L&T Technology Services
L&T Technology Services Limited operates as an engineering research and development services company in India, North America, Europe, and internationally.
Flawless balance sheet with acceptable track record.

