
Advertisement
- India
- /
- Construction
- /
- NSEI:VLINFRA
V.L.Infraprojects Limited's (NSE:VLINFRA) Stock Has Been Sliding But Fundamentals Look Strong: Is The Market Wrong?
V.L.Infraprojects (NSE:VLINFRA) has had a rough three months with its share price down 32%. However, a closer look at its sound financials might cause you to think again. Given that fundamentals usually drive long-term market outcomes, the company is worth looking at. In this article, we decided to focus on V.L.Infraprojects' ROE.
Return on Equity or ROE is a test of how effectively a company is growing its value and managing investors’ money. Simply put, it is used to assess the profitability of a company in relation to its equity capital.
How To Calculate Return On Equity?
Return on equity can be calculated by using the formula:
Return on Equity = Net Profit (from continuing operations) ÷ Shareholders' Equity
So, based on the above formula, the ROE for V.L.Infraprojects is:
17% = ₹70m ÷ ₹419m (Based on the trailing twelve months to March 2025).
The 'return' is the income the business earned over the last year. Another way to think of that is that for every ₹1 worth of equity, the company was able to earn ₹0.17 in profit.
Check out our latest analysis for V.L.Infraprojects
Why Is ROE Important For Earnings Growth?
Thus far, we have learned that ROE measures how efficiently a company is generating its profits. We now need to evaluate how much profit the company reinvests or "retains" for future growth which then gives us an idea about the growth potential of the company. Assuming everything else remains unchanged, the higher the ROE and profit retention, the higher the growth rate of a company compared to companies that don't necessarily bear these characteristics.
V.L.Infraprojects' Earnings Growth And 17% ROE
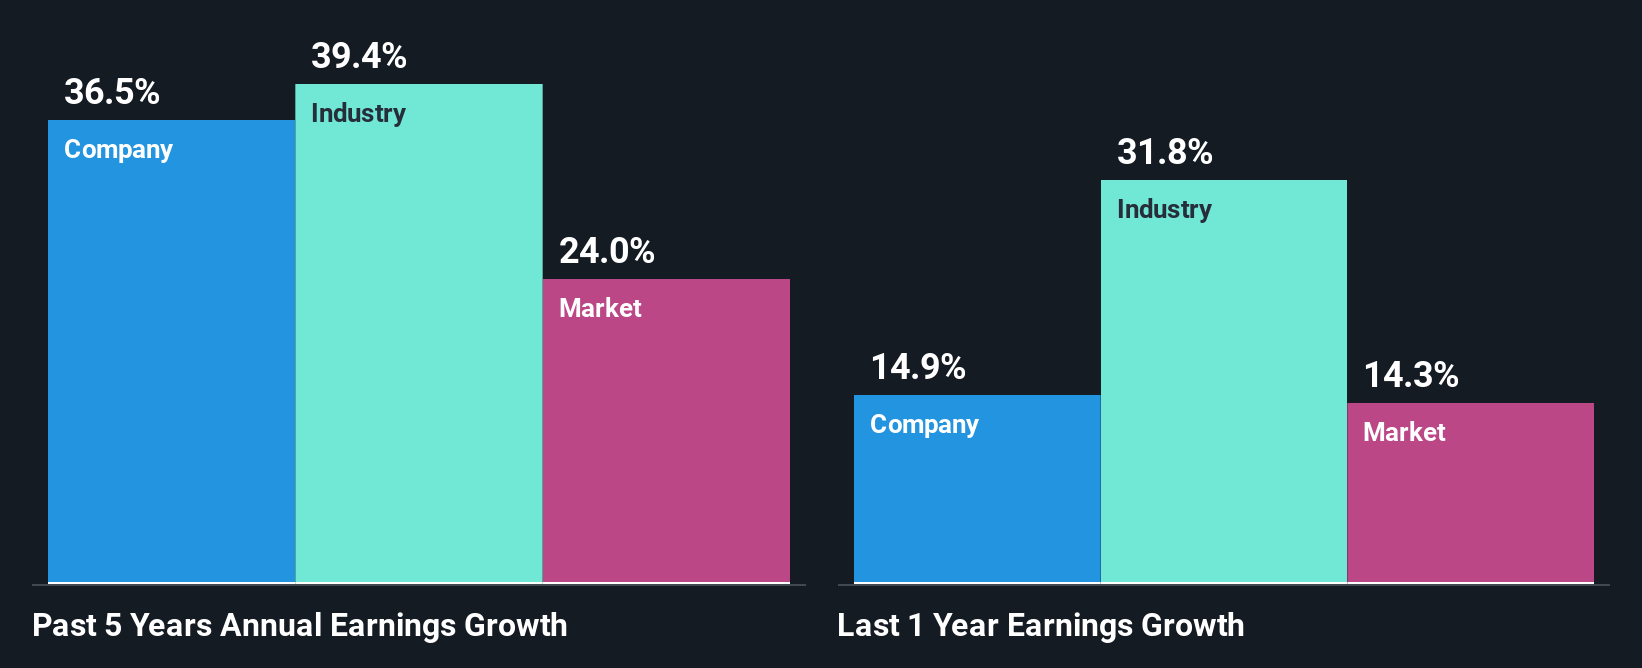
At first glance, V.L.Infraprojects seems to have a decent ROE. Especially when compared to the industry average of 14% the company's ROE looks pretty impressive. This certainly adds some context to V.L.Infraprojects' exceptional 37% net income growth seen over the past five years. We reckon that there could also be other factors at play here. For instance, the company has a low payout ratio or is being managed efficiently.
Next, on comparing V.L.Infraprojects' net income growth with the industry, we found that the company's reported growth is similar to the industry average growth rate of 39% over the last few years.
The basis for attaching value to a company is, to a great extent, tied to its earnings growth. The investor should try to establish if the expected growth or decline in earnings, whichever the case may be, is priced in. By doing so, they will have an idea if the stock is headed into clear blue waters or if swampy waters await. If you're wondering about V.L.Infraprojects''s valuation, check out this gauge of its price-to-earnings ratio, as compared to its industry.
Is V.L.Infraprojects Making Efficient Use Of Its Profits?
Given that V.L.Infraprojects doesn't pay any regular dividends to its shareholders, we infer that the company has been reinvesting all of its profits to grow its business.
Summary
On the whole, we feel that V.L.Infraprojects' performance has been quite good. Particularly, we like that the company is reinvesting heavily into its business, and at a high rate of return. Unsurprisingly, this has led to an impressive earnings growth. If the company continues to grow its earnings the way it has, that could have a positive impact on its share price given how earnings per share influence long-term share prices. Let's not forget, business risk is also one of the factors that affects the price of the stock. So this is also an important area that investors need to pay attention to before making a decision on any business. Our risks dashboard would have the 3 risks we have identified for V.L.Infraprojects.
New: Manage All Your Stock Portfolios in One Place
We've created the ultimate portfolio companion for stock investors, and it's free.
• Connect an unlimited number of Portfolios and see your total in one currency
• Be alerted to new Warning Signs or Risks via email or mobile
• Track the Fair Value of your stocks
Have feedback on this article? Concerned about the content? Get in touch with us directly. Alternatively, email editorial-team (at) simplywallst.com.
This article by Simply Wall St is general in nature. We provide commentary based on historical data and analyst forecasts only using an unbiased methodology and our articles are not intended to be financial advice. It does not constitute a recommendation to buy or sell any stock, and does not take account of your objectives, or your financial situation. We aim to bring you long-term focused analysis driven by fundamental data. Note that our analysis may not factor in the latest price-sensitive company announcements or qualitative material. Simply Wall St has no position in any stocks mentioned.
About NSEI:VLINFRA
V.L.Infraprojects
Engages in the designing, construction, and commissioning of various infrastructure projects, including irrigation and water supply in India.
Excellent balance sheet with low risk.
Similar Companies
Market Insights

Advertisement
Community Narratives
The company that turned a verb into a global necessity and basically runs the modern internet, digital ads, smartphones, maps, and AI.
Fair Value US$300.00|5.1% undervalued
OS
Community Contributor
Flowers Foods Pays A Fair Price For Health
Fair Value US$16.12|27.7% undervalued
NV
Community Contributor
TMX Group will thrive with 33.3% profit margin and enduring market moat
Fair Value CA$49.90|0.2% overvalued
LI
Community Contributor
The "Molecular Pencil": Why Beam's Technology is Built to Win
Fair Value US$65.01|64.4% undervalued
DA
Community Contributor