- India
- /
- Electrical
- /
- NSEI:SPECTRUM
Optimistic Investors Push Spectrum Electrical Industries Limited (NSE:SPECTRUM) Shares Up 27% But Growth Is Lacking
Despite an already strong run, Spectrum Electrical Industries Limited (NSE:SPECTRUM) shares have been powering on, with a gain of 27% in the last thirty days. This latest share price bounce rounds out a remarkable 1,659% gain over the last twelve months.
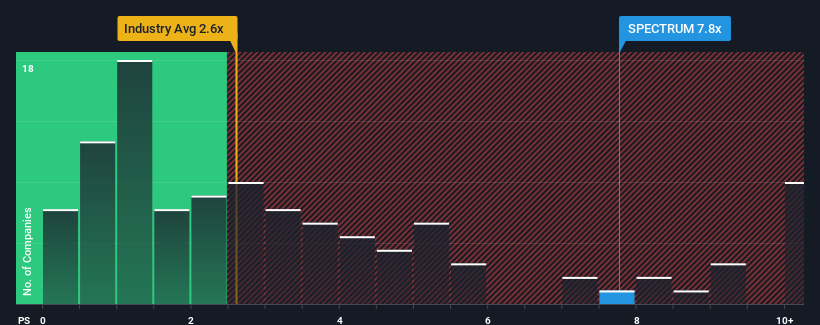
Following the firm bounce in price, you could be forgiven for thinking Spectrum Electrical Industries is a stock to steer clear of with a price-to-sales ratios (or "P/S") of 7.8x, considering almost half the companies in India's Electrical industry have P/S ratios below 2.6x. Although, it's not wise to just take the P/S at face value as there may be an explanation why it's so lofty.
Check out our latest analysis for Spectrum Electrical Industries

What Does Spectrum Electrical Industries' Recent Performance Look Like?
Revenue has risen at a steady rate over the last year for Spectrum Electrical Industries, which is generally not a bad outcome. One possibility is that the P/S ratio is high because investors think this good revenue growth will be enough to outperform the broader industry in the near future. If not, then existing shareholders may be a little nervous about the viability of the share price.
Want the full picture on earnings, revenue and cash flow for the company? Then our free report on Spectrum Electrical Industries will help you shine a light on its historical performance.How Is Spectrum Electrical Industries' Revenue Growth Trending?
In order to justify its P/S ratio, Spectrum Electrical Industries would need to produce outstanding growth that's well in excess of the industry.
Taking a look back first, we see that the company managed to grow revenues by a handy 2.6% last year. Pleasingly, revenue has also lifted 113% in aggregate from three years ago, partly thanks to the last 12 months of growth. Accordingly, shareholders would have definitely welcomed those medium-term rates of revenue growth.
It's interesting to note that the rest of the industry is similarly expected to grow by 28% over the next year, which is fairly even with the company's recent medium-term annualised growth rates.
In light of this, it's curious that Spectrum Electrical Industries' P/S sits above the majority of other companies. It seems most investors are ignoring the fairly average recent growth rates and are willing to pay up for exposure to the stock. Although, additional gains will be difficult to achieve as a continuation of recent revenue trends would weigh down the share price eventually.
What Does Spectrum Electrical Industries' P/S Mean For Investors?
The strong share price surge has lead to Spectrum Electrical Industries' P/S soaring as well. We'd say the price-to-sales ratio's power isn't primarily as a valuation instrument but rather to gauge current investor sentiment and future expectations.
We didn't expect to see Spectrum Electrical Industries trade at such a high P/S considering its last three-year revenue growth has only been on par with the rest of the industry. When we see average revenue with industry-like growth combined with a high P/S, we suspect the share price is at risk of declining, bringing the P/S back in line with the industry too. Unless the recent medium-term conditions improve, it's challenging to accept these prices as being reasonable.
It's always necessary to consider the ever-present spectre of investment risk. We've identified 1 warning sign with Spectrum Electrical Industries, and understanding should be part of your investment process.
If companies with solid past earnings growth is up your alley, you may wish to see this free collection of other companies with strong earnings growth and low P/E ratios.
New: Manage All Your Stock Portfolios in One Place
We've created the ultimate portfolio companion for stock investors, and it's free.
• Connect an unlimited number of Portfolios and see your total in one currency
• Be alerted to new Warning Signs or Risks via email or mobile
• Track the Fair Value of your stocks
Have feedback on this article? Concerned about the content? Get in touch with us directly. Alternatively, email editorial-team (at) simplywallst.com.
This article by Simply Wall St is general in nature. We provide commentary based on historical data and analyst forecasts only using an unbiased methodology and our articles are not intended to be financial advice. It does not constitute a recommendation to buy or sell any stock, and does not take account of your objectives, or your financial situation. We aim to bring you long-term focused analysis driven by fundamental data. Note that our analysis may not factor in the latest price-sensitive company announcements or qualitative material. Simply Wall St has no position in any stocks mentioned.
About NSEI:SPECTRUM
Spectrum Electrical Industries
Designs, manufactures, and sells electrical, automobile, and irrigation components in India.
Adequate balance sheet with acceptable track record.
Market Insights
Community Narratives


Recently Updated Narratives


MINISO's fair value is projected at 26.69 with an anticipated PE ratio shift of 20x


The Quiet Giant That Became AI’s Power Grid


Nova Ljubljanska Banka d.d will expect a 11.2% revenue boost driving future growth
Popular Narratives


The company that turned a verb into a global necessity and basically runs the modern internet, digital ads, smartphones, maps, and AI.


MicroVision will explode future revenue by 380.37% with a vision towards success


