
Advertisement
Should You Be Impressed By Synergy Green Industries Limited's (NSE:SGIL) ROE?
While some investors are already well versed in financial metrics (hat tip), this article is for those who would like to learn about Return On Equity (ROE) and why it is important. We'll use ROE to examine Synergy Green Industries Limited (NSE:SGIL), by way of a worked example.
Return on Equity or ROE is a test of how effectively a company is growing its value and managing investors’ money. Simply put, it is used to assess the profitability of a company in relation to its equity capital.
See our latest analysis for Synergy Green Industries
How To Calculate Return On Equity?
ROE can be calculated by using the formula:
Return on Equity = Net Profit (from continuing operations) ÷ Shareholders' Equity
So, based on the above formula, the ROE for Synergy Green Industries is:
29% = ₹117m ÷ ₹409m (Based on the trailing twelve months to December 2023).
The 'return' is the profit over the last twelve months. One way to conceptualize this is that for each ₹1 of shareholders' capital it has, the company made ₹0.29 in profit.
Does Synergy Green Industries Have A Good ROE?
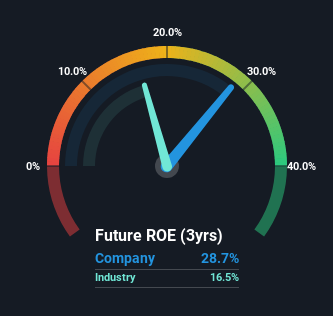
Arguably the easiest way to assess company's ROE is to compare it with the average in its industry. The limitation of this approach is that some companies are quite different from others, even within the same industry classification. As is clear from the image below, Synergy Green Industries has a better ROE than the average (17%) in the Machinery industry.
That is a good sign. Bear in mind, a high ROE doesn't always mean superior financial performance. Aside from changes in net income, a high ROE can also be the outcome of high debt relative to equity, which indicates risk. To know the 2 risks we have identified for Synergy Green Industries visit our risks dashboard for free.
Why You Should Consider Debt When Looking At ROE
Most companies need money -- from somewhere -- to grow their profits. That cash can come from retained earnings, issuing new shares (equity), or debt. In the case of the first and second options, the ROE will reflect this use of cash, for growth. In the latter case, the use of debt will improve the returns, but will not change the equity. That will make the ROE look better than if no debt was used.
Combining Synergy Green Industries' Debt And Its 29% Return On Equity
Synergy Green Industries clearly uses a high amount of debt to boost returns, as it has a debt to equity ratio of 1.89. Its ROE is pretty impressive but, it would have probably been lower without the use of debt. Debt does bring extra risk, so it's only really worthwhile when a company generates some decent returns from it.
Summary
Return on equity is one way we can compare its business quality of different companies. A company that can achieve a high return on equity without debt could be considered a high quality business. If two companies have around the same level of debt to equity, and one has a higher ROE, I'd generally prefer the one with higher ROE.
But ROE is just one piece of a bigger puzzle, since high quality businesses often trade on high multiples of earnings. Profit growth rates, versus the expectations reflected in the price of the stock, are a particularly important to consider. You can see how the company has grow in the past by looking at this FREE detailed graph of past earnings, revenue and cash flow.
But note: Synergy Green Industries may not be the best stock to buy. So take a peek at this free list of interesting companies with high ROE and low debt.
New: Manage All Your Stock Portfolios in One Place
We've created the ultimate portfolio companion for stock investors, and it's free.
• Connect an unlimited number of Portfolios and see your total in one currency
• Be alerted to new Warning Signs or Risks via email or mobile
• Track the Fair Value of your stocks
Have feedback on this article? Concerned about the content? Get in touch with us directly. Alternatively, email editorial-team (at) simplywallst.com.
This article by Simply Wall St is general in nature. We provide commentary based on historical data and analyst forecasts only using an unbiased methodology and our articles are not intended to be financial advice. It does not constitute a recommendation to buy or sell any stock, and does not take account of your objectives, or your financial situation. We aim to bring you long-term focused analysis driven by fundamental data. Note that our analysis may not factor in the latest price-sensitive company announcements or qualitative material. Simply Wall St has no position in any stocks mentioned.
About NSEI:SGIL
Synergy Green Industries
Engages in the manufacture and sale of wind turbine casting and other large precision castings in India.
Proven track record with imperfect balance sheet.
Similar Companies
Market Insights

Advertisement
Community Narratives
The company that turned a verb into a global necessity and basically runs the modern internet, digital ads, smartphones, maps, and AI.
Fair Value US$300.00|6.3% undervalued
OS
Community Contributor
Flowers Foods Pays A Fair Price For Health
Fair Value US$16.12|26.0% undervalued
NV
Community Contributor
TMX Group will thrive with 33.3% profit margin and enduring market moat
Fair Value CA$49.90|3.7% overvalued
LI
Community Contributor