Prakash Pipes' (NSE:PPL) five-year earnings growth trails the fantastic shareholder returns


Long term investing can be life changing when you buy and hold the truly great businesses. While not every stock performs well, when investors win, they can win big. Don't believe it? Then look at the Prakash Pipes Limited (NSE:PPL) share price. It's 321% higher than it was five years ago. If that doesn't get you thinking about long term investing, we don't know what will. It's also good to see the share price up 32% over the last quarter. This could be related to the recent financial results, released recently - you can catch up on the most recent data by reading our company report.
Since the stock has added ₹1.2b to its market cap in the past week alone, let's see if underlying performance has been driving long-term returns.
See our latest analysis for Prakash Pipes
To quote Buffett, 'Ships will sail around the world but the Flat Earth Society will flourish. There will continue to be wide discrepancies between price and value in the marketplace...' One flawed but reasonable way to assess how sentiment around a company has changed is to compare the earnings per share (EPS) with the share price.
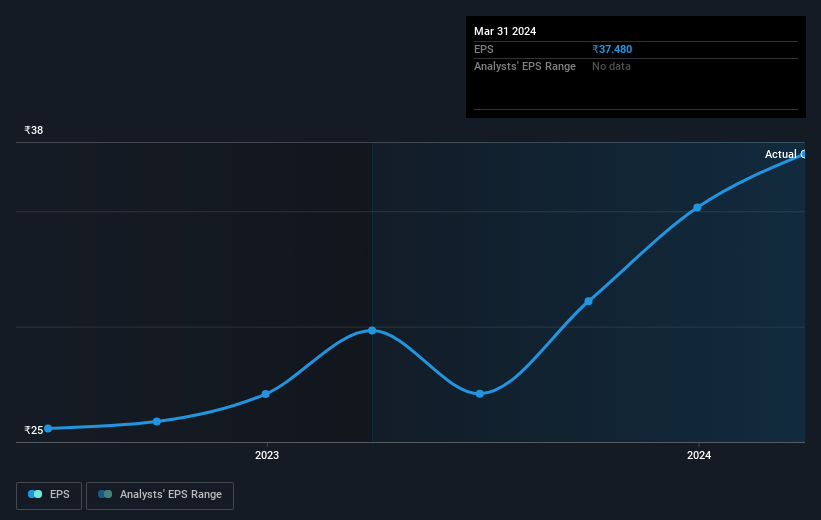
During five years of share price growth, Prakash Pipes achieved compound earnings per share (EPS) growth of 22% per year. This EPS growth is lower than the 33% average annual increase in the share price. This suggests that market participants hold the company in higher regard, these days. And that's hardly shocking given the track record of growth.
The graphic below depicts how EPS has changed over time (unveil the exact values by clicking on the image).
Before buying or selling a stock, we always recommend a close examination of historic growth trends, available here.
What About Dividends?
It is important to consider the total shareholder return, as well as the share price return, for any given stock. The TSR is a return calculation that accounts for the value of cash dividends (assuming that any dividend received was reinvested) and the calculated value of any discounted capital raisings and spin-offs. Arguably, the TSR gives a more comprehensive picture of the return generated by a stock. In the case of Prakash Pipes, it has a TSR of 344% for the last 5 years. That exceeds its share price return that we previously mentioned. This is largely a result of its dividend payments!
A Different Perspective
We're pleased to report that Prakash Pipes shareholders have received a total shareholder return of 168% over one year. And that does include the dividend. That's better than the annualised return of 35% over half a decade, implying that the company is doing better recently. Someone with an optimistic perspective could view the recent improvement in TSR as indicating that the business itself is getting better with time. While it is well worth considering the different impacts that market conditions can have on the share price, there are other factors that are even more important. For example, we've discovered 1 warning sign for Prakash Pipes that you should be aware of before investing here.
For those who like to find winning investments this free list of undervalued companies with recent insider purchasing, could be just the ticket.
Please note, the market returns quoted in this article reflect the market weighted average returns of stocks that currently trade on Indian exchanges.
New: Manage All Your Stock Portfolios in One Place
We've created the ultimate portfolio companion for stock investors, and it's free.
• Connect an unlimited number of Portfolios and see your total in one currency
• Be alerted to new Warning Signs or Risks via email or mobile
• Track the Fair Value of your stocks
Have feedback on this article? Concerned about the content? Get in touch with us directly. Alternatively, email editorial-team (at) simplywallst.com.
This article by Simply Wall St is general in nature. We provide commentary based on historical data and analyst forecasts only using an unbiased methodology and our articles are not intended to be financial advice. It does not constitute a recommendation to buy or sell any stock, and does not take account of your objectives, or your financial situation. We aim to bring you long-term focused analysis driven by fundamental data. Note that our analysis may not factor in the latest price-sensitive company announcements or qualitative material. Simply Wall St has no position in any stocks mentioned.
About NSEI:PPL
Prakash Pipes
Manufactures and sells PVC pipes and fittings, and flexible packaging products in India and internationally.
Outstanding track record with excellent balance sheet.

