Stock Analysis
Most readers would already be aware that INOX India's (NSE:INOXINDIA) stock increased significantly by 36% over the past three months. Given the company's impressive performance, we decided to study its financial indicators more closely as a company's financial health over the long-term usually dictates market outcomes. In this article, we decided to focus on INOX India's ROE.
Return on Equity or ROE is a test of how effectively a company is growing its value and managing investors’ money. In simpler terms, it measures the profitability of a company in relation to shareholder's equity.
Check out our latest analysis for INOX India
How To Calculate Return On Equity?
The formula for ROE is:
Return on Equity = Net Profit (from continuing operations) ÷ Shareholders' Equity
So, based on the above formula, the ROE for INOX India is:
33% = ₹1.8b ÷ ₹5.5b (Based on the trailing twelve months to December 2023).
The 'return' refers to a company's earnings over the last year. That means that for every ₹1 worth of shareholders' equity, the company generated ₹0.33 in profit.
What Has ROE Got To Do With Earnings Growth?
We have already established that ROE serves as an efficient profit-generating gauge for a company's future earnings. Based on how much of its profits the company chooses to reinvest or "retain", we are then able to evaluate a company's future ability to generate profits. Assuming all else is equal, companies that have both a higher return on equity and higher profit retention are usually the ones that have a higher growth rate when compared to companies that don't have the same features.
INOX India's Earnings Growth And 33% ROE
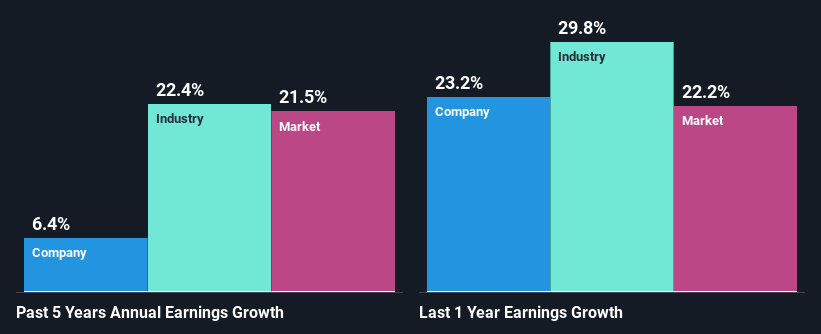
Firstly, we acknowledge that INOX India has a significantly high ROE. Additionally, the company's ROE is higher compared to the industry average of 16% which is quite remarkable. This likely paved the way for the modest 6.4% net income growth seen by INOX India over the past five years.
We then compared INOX India's net income growth with the industry and found that the company's growth figure is lower than the average industry growth rate of 22% in the same 5-year period, which is a bit concerning.
The basis for attaching value to a company is, to a great extent, tied to its earnings growth. The investor should try to establish if the expected growth or decline in earnings, whichever the case may be, is priced in. By doing so, they will have an idea if the stock is headed into clear blue waters or if swampy waters await. If you're wondering about INOX India's's valuation, check out this gauge of its price-to-earnings ratio, as compared to its industry.
Is INOX India Using Its Retained Earnings Effectively?
While the company did pay out a portion of its dividend in the past, it currently doesn't pay a dividend. We infer that the company has been reinvesting all of its profits to grow its business.
Summary
On the whole, we feel that INOX India's performance has been quite good. In particular, it's great to see that the company is investing heavily into its business and along with a high rate of return, that has resulted in a respectable growth in its earnings. With that said, the latest industry analyst forecasts reveal that the company's earnings are expected to accelerate. To know more about the company's future earnings growth forecasts take a look at this free report on analyst forecasts for the company to find out more.
Valuation is complex, but we're helping make it simple.
Find out whether INOX India is potentially over or undervalued by checking out our comprehensive analysis, which includes fair value estimates, risks and warnings, dividends, insider transactions and financial health.
View the Free AnalysisHave feedback on this article? Concerned about the content? Get in touch with us directly. Alternatively, email editorial-team (at) simplywallst.com.
This article by Simply Wall St is general in nature. We provide commentary based on historical data and analyst forecasts only using an unbiased methodology and our articles are not intended to be financial advice. It does not constitute a recommendation to buy or sell any stock, and does not take account of your objectives, or your financial situation. We aim to bring you long-term focused analysis driven by fundamental data. Note that our analysis may not factor in the latest price-sensitive company announcements or qualitative material. Simply Wall St has no position in any stocks mentioned.
About NSEI:INOXINDIA
INOX India
INOX India Limited manufactures and supplies cryogenic liquid storage and transport tanks for gas companies and other customers online in India and internationally.
Exceptional growth potential with solid track record.

