Stock Analysis
- India
- /
- Industrials
- /
- NSEI:GODREJIND
Should Godrej Industries Limited (NSE:GODREJIND) Focus On Improving This Fundamental Metric?


One of the best investments we can make is in our own knowledge and skill set. With that in mind, this article will work through how we can use Return On Equity (ROE) to better understand a business. To keep the lesson grounded in practicality, we'll use ROE to better understand Godrej Industries Limited (NSE:GODREJIND).
ROE or return on equity is a useful tool to assess how effectively a company can generate returns on the investment it received from its shareholders. Put another way, it reveals the company's success at turning shareholder investments into profits.
See our latest analysis for Godrej Industries
How Do You Calculate Return On Equity?
ROE can be calculated by using the formula:
Return on Equity = Net Profit (from continuing operations) ÷ Shareholders' Equity
So, based on the above formula, the ROE for Godrej Industries is:
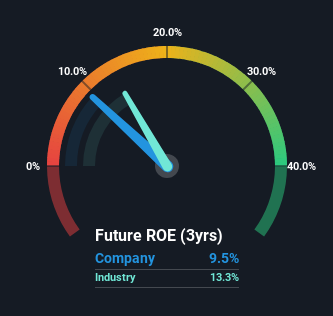
9.5% = ₹14b ÷ ₹147b (Based on the trailing twelve months to September 2023).
The 'return' is the profit over the last twelve months. One way to conceptualize this is that for each ₹1 of shareholders' capital it has, the company made ₹0.10 in profit.
Does Godrej Industries Have A Good Return On Equity?
One simple way to determine if a company has a good return on equity is to compare it to the average for its industry. However, this method is only useful as a rough check, because companies do differ quite a bit within the same industry classification. As shown in the graphic below, Godrej Industries has a lower ROE than the average (13%) in the Industrials industry classification.
Unfortunately, that's sub-optimal. That being said, a low ROE is not always a bad thing, especially if the company has low leverage as this still leaves room for improvement if the company were to take on more debt. When a company has low ROE but high debt levels, we would be cautious as the risk involved is too high. To know the 2 risks we have identified for Godrej Industries visit our risks dashboard for free.
The Importance Of Debt To Return On Equity
Most companies need money -- from somewhere -- to grow their profits. That cash can come from retained earnings, issuing new shares (equity), or debt. In the case of the first and second options, the ROE will reflect this use of cash, for growth. In the latter case, the debt required for growth will boost returns, but will not impact the shareholders' equity. That will make the ROE look better than if no debt was used.
Godrej Industries' Debt And Its 9.5% ROE
Godrej Industries clearly uses a high amount of debt to boost returns, as it has a debt to equity ratio of 1.71. With a fairly low ROE, and significant use of debt, it's hard to get excited about this business at the moment. Investors should think carefully about how a company might perform if it was unable to borrow so easily, because credit markets do change over time.
Conclusion
Return on equity is useful for comparing the quality of different businesses. A company that can achieve a high return on equity without debt could be considered a high quality business. If two companies have around the same level of debt to equity, and one has a higher ROE, I'd generally prefer the one with higher ROE.
But when a business is high quality, the market often bids it up to a price that reflects this. It is important to consider other factors, such as future profit growth -- and how much investment is required going forward. You can see how the company has grow in the past by looking at this FREE detailed graph of past earnings, revenue and cash flow.
If you would prefer check out another company -- one with potentially superior financials -- then do not miss this free list of interesting companies, that have HIGH return on equity and low debt.
New: Manage All Your Stock Portfolios in One Place
We've created the ultimate portfolio companion for stock investors, and it's free.
• Connect an unlimited number of Portfolios and see your total in one currency
• Be alerted to new Warning Signs or Risks via email or mobile
• Track the Fair Value of your stocks
Have feedback on this article? Concerned about the content? Get in touch with us directly. Alternatively, email editorial-team (at) simplywallst.com.
This article by Simply Wall St is general in nature. We provide commentary based on historical data and analyst forecasts only using an unbiased methodology and our articles are not intended to be financial advice. It does not constitute a recommendation to buy or sell any stock, and does not take account of your objectives, or your financial situation. We aim to bring you long-term focused analysis driven by fundamental data. Note that our analysis may not factor in the latest price-sensitive company announcements or qualitative material. Simply Wall St has no position in any stocks mentioned.
About NSEI:GODREJIND
Godrej Industries
Engages in the chemical, consumer goods, real estate, agriculture, and financial services businesses in India and Internationally.
Low with imperfect balance sheet.
