
Advertisement
- India
- /
- Aerospace & Defense
- /
- NSEI:BDL
Bharat Dynamics' (NSE:BDL) Solid Earnings May Rest On Weak Foundations
The recent earnings posted by Bharat Dynamics Limited (NSE:BDL) were solid, but the stock didn't move as much as we expected. However the statutory profit number doesn't tell the whole story, and we have found some factors which might be of concern to shareholders.
Examining Cashflow Against Bharat Dynamics' Earnings
In high finance, the key ratio used to measure how well a company converts reported profits into free cash flow (FCF) is the accrual ratio (from cashflow). The accrual ratio subtracts the FCF from the profit for a given period, and divides the result by the average operating assets of the company over that time. The ratio shows us how much a company's profit exceeds its FCF.
As a result, a negative accrual ratio is a positive for the company, and a positive accrual ratio is a negative. While it's not a problem to have a positive accrual ratio, indicating a certain level of non-cash profits, a high accrual ratio is arguably a bad thing, because it indicates paper profits are not matched by cash flow. To quote a 2014 paper by Lewellen and Resutek, "firms with higher accruals tend to be less profitable in the future".
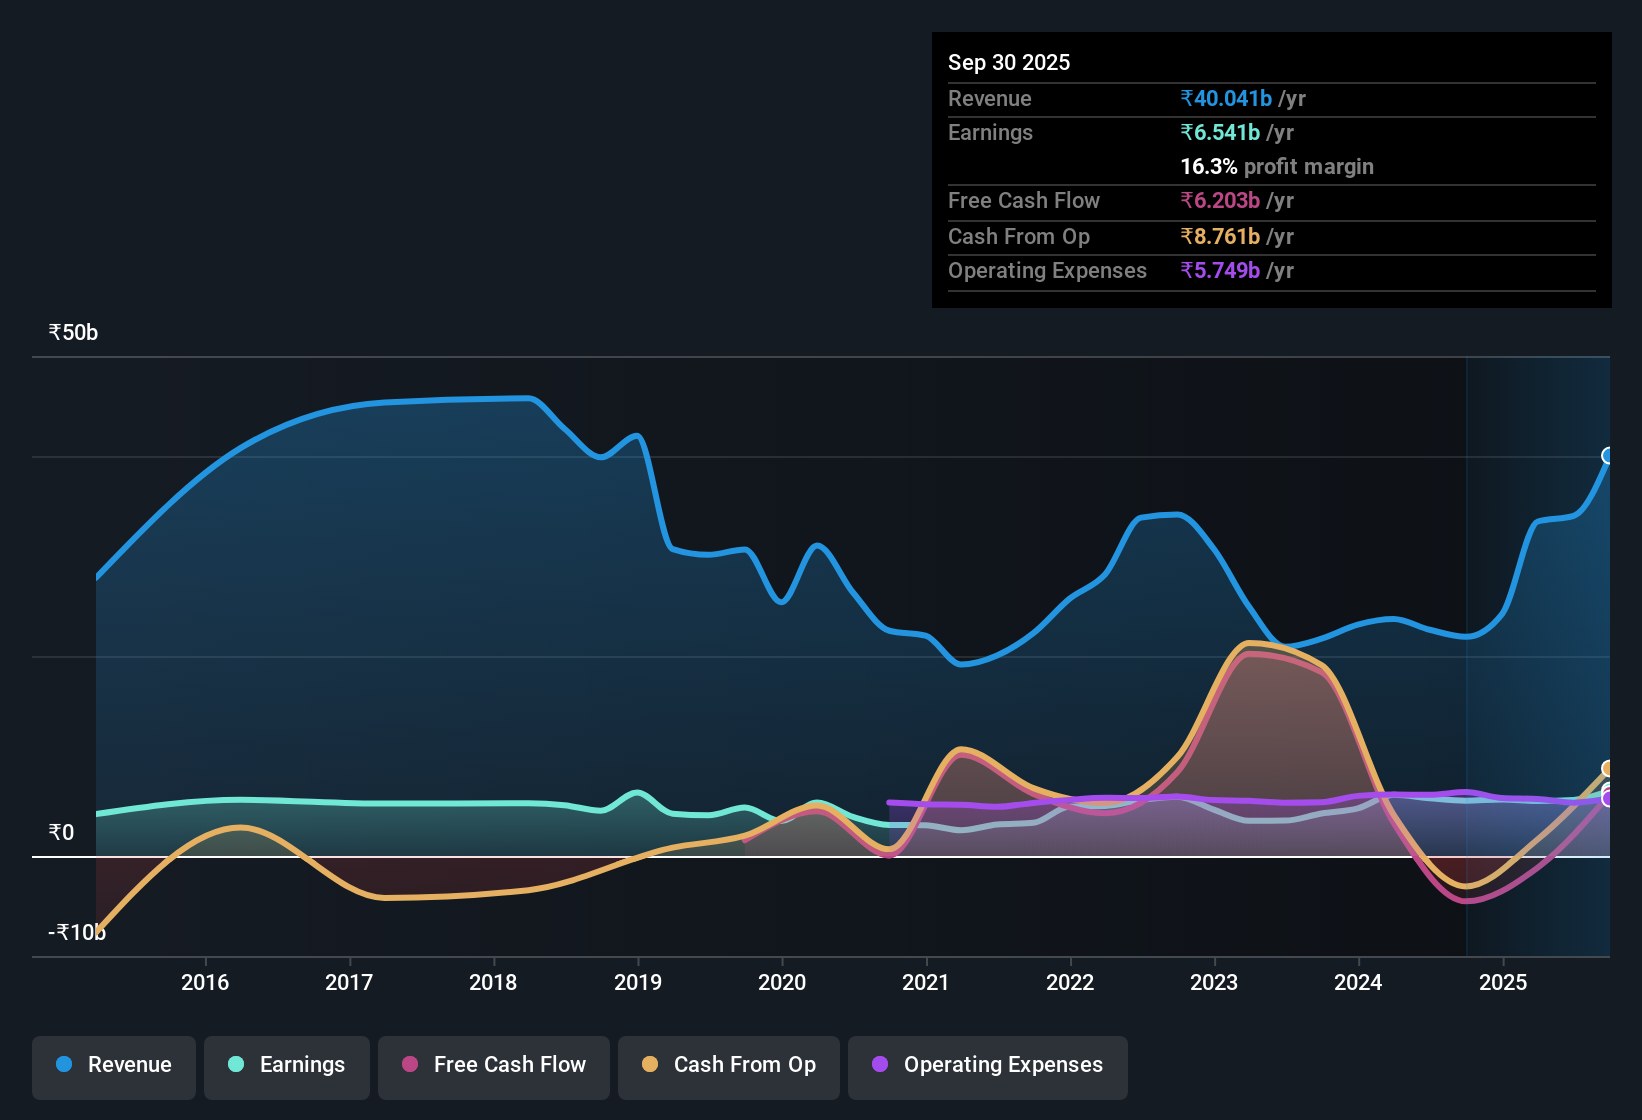
For the year to September 2025, Bharat Dynamics had an accrual ratio of 0.23. We can therefore deduce that its free cash flow fell well short of covering its statutory profit. In fact, it had free cash flow of ₹6.2b in the last year, which was a lot less than its statutory profit of ₹6.54b. Notably, Bharat Dynamics had negative free cash flow last year, so the ₹6.2b it produced this year was a welcome improvement.
That might leave you wondering what analysts are forecasting in terms of future profitability. Luckily, you can click here to see an interactive graph depicting future profitability, based on their estimates.
Our Take On Bharat Dynamics' Profit Performance
Bharat Dynamics' accrual ratio for the last twelve months signifies cash conversion is less than ideal, which is a negative when it comes to our view of its earnings. Therefore, it seems possible to us that Bharat Dynamics' true underlying earnings power is actually less than its statutory profit. Nonetheless, it's still worth noting that its earnings per share have grown at 10% over the last three years. Of course, we've only just scratched the surface when it comes to analysing its earnings; one could also consider margins, forecast growth, and return on investment, among other factors. If you want to do dive deeper into Bharat Dynamics, you'd also look into what risks it is currently facing. For example, we've found that Bharat Dynamics has 3 warning signs (1 makes us a bit uncomfortable!) that deserve your attention before going any further with your analysis.
This note has only looked at a single factor that sheds light on the nature of Bharat Dynamics' profit. But there are plenty of other ways to inform your opinion of a company. Some people consider a high return on equity to be a good sign of a quality business. So you may wish to see this free collection of companies boasting high return on equity, or this list of stocks with high insider ownership.
Valuation is complex, but we're here to simplify it.
Discover if Bharat Dynamics might be undervalued or overvalued with our detailed analysis, featuring fair value estimates, potential risks, dividends, insider trades, and its financial condition.
Access Free AnalysisHave feedback on this article? Concerned about the content? Get in touch with us directly. Alternatively, email editorial-team (at) simplywallst.com.
This article by Simply Wall St is general in nature. We provide commentary based on historical data and analyst forecasts only using an unbiased methodology and our articles are not intended to be financial advice. It does not constitute a recommendation to buy or sell any stock, and does not take account of your objectives, or your financial situation. We aim to bring you long-term focused analysis driven by fundamental data. Note that our analysis may not factor in the latest price-sensitive company announcements or qualitative material. Simply Wall St has no position in any stocks mentioned.
About NSEI:BDL
Bharat Dynamics
Manufactures and sells guided missiles, underwater weapons, air-borne products, and allied defense equipment in India.
Exceptional growth potential with flawless balance sheet.
Market Insights

Advertisement
Community Narratives
MicroVision will explode future revenue by 380.37% with a vision towards success
Fair Value US$60.00|98.5% undervalued
TH
Community Contributor
The Indispensable Artery for a New North American Economy
Fair Value CA$132.87|2.3% undervalued
TI
Community Contributor