
Advertisement
- India
- /
- Trade Distributors
- /
- NSEI:ANMOL
Investors Could Be Concerned With Anmol India's (NSE:ANMOL) Returns On Capital
Finding a business that has the potential to grow substantially is not easy, but it is possible if we look at a few key financial metrics. Ideally, a business will show two trends; firstly a growing return on capital employed (ROCE) and secondly, an increasing amount of capital employed. Ultimately, this demonstrates that it's a business that is reinvesting profits at increasing rates of return. Although, when we looked at Anmol India (NSE:ANMOL), it didn't seem to tick all of these boxes.
We've discovered 4 warning signs about Anmol India. View them for free.Return On Capital Employed (ROCE): What Is It?
For those who don't know, ROCE is a measure of a company's yearly pre-tax profit (its return), relative to the capital employed in the business. Analysts use this formula to calculate it for Anmol India:
Return on Capital Employed = Earnings Before Interest and Tax (EBIT) ÷ (Total Assets - Current Liabilities)
0.094 = ₹138m ÷ (₹3.9b - ₹2.4b) (Based on the trailing twelve months to December 2024).
Therefore, Anmol India has an ROCE of 9.4%. In absolute terms, that's a low return, but it's much better than the Trade Distributors industry average of 6.8%.
View our latest analysis for Anmol India
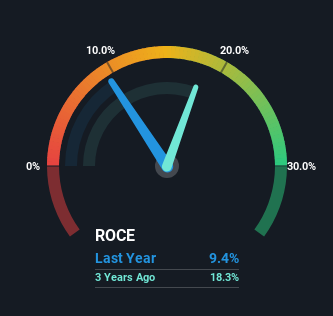
Historical performance is a great place to start when researching a stock so above you can see the gauge for Anmol India's ROCE against it's prior returns. If you want to delve into the historical earnings , check out these free graphs detailing revenue and cash flow performance of Anmol India.
What Can We Tell From Anmol India's ROCE Trend?
When we looked at the ROCE trend at Anmol India, we didn't gain much confidence. Over the last five years, returns on capital have decreased to 9.4% from 12% five years ago. On the other hand, the company has been employing more capital without a corresponding improvement in sales in the last year, which could suggest these investments are longer term plays. It's worth keeping an eye on the company's earnings from here on to see if these investments do end up contributing to the bottom line.
On a side note, Anmol India's current liabilities have increased over the last five years to 62% of total assets, effectively distorting the ROCE to some degree. Without this increase, it's likely that ROCE would be even lower than 9.4%. And with current liabilities at these levels, suppliers or short-term creditors are effectively funding a large part of the business, which can introduce some risks.
What We Can Learn From Anmol India's ROCE
In summary, Anmol India is reinvesting funds back into the business for growth but unfortunately it looks like sales haven't increased much just yet. And in the last three years, the stock has given away 54% so the market doesn't look too hopeful on these trends strengthening any time soon. Therefore based on the analysis done in this article, we don't think Anmol India has the makings of a multi-bagger.
If you want to continue researching Anmol India, you might be interested to know about the 4 warning signs that our analysis has discovered.
For those who like to invest in solid companies, check out this free list of companies with solid balance sheets and high returns on equity.
New: Manage All Your Stock Portfolios in One Place
We've created the ultimate portfolio companion for stock investors, and it's free.
• Connect an unlimited number of Portfolios and see your total in one currency
• Be alerted to new Warning Signs or Risks via email or mobile
• Track the Fair Value of your stocks
Have feedback on this article? Concerned about the content? Get in touch with us directly. Alternatively, email editorial-team (at) simplywallst.com.
This article by Simply Wall St is general in nature. We provide commentary based on historical data and analyst forecasts only using an unbiased methodology and our articles are not intended to be financial advice. It does not constitute a recommendation to buy or sell any stock, and does not take account of your objectives, or your financial situation. We aim to bring you long-term focused analysis driven by fundamental data. Note that our analysis may not factor in the latest price-sensitive company announcements or qualitative material. Simply Wall St has no position in any stocks mentioned.
About NSEI:ANMOL
Mediocre balance sheet with low risk.
Similar Companies
Market Insights

Advertisement
Community Narratives
The company that turned a verb into a global necessity and basically runs the modern internet, digital ads, smartphones, maps, and AI.
Fair Value US$300.00|6.3% undervalued
OS
Community Contributor
Flowers Foods Pays A Fair Price For Health
Fair Value US$16.12|26.0% undervalued
NV
Community Contributor
TMX Group will thrive with 33.3% profit margin and enduring market moat
Fair Value CA$49.90|3.7% overvalued
LI
Community Contributor