Stock Analysis
- India
- /
- Auto Components
- /
- NSEI:SUNDRMFAST
Sundram Fasteners' (NSE:SUNDRMFAST) 23% CAGR outpaced the company's earnings growth over the same five-year period


The most you can lose on any stock (assuming you don't use leverage) is 100% of your money. But on the bright side, you can make far more than 100% on a really good stock. For instance, the price of Sundram Fasteners Limited (NSE:SUNDRMFAST) stock is up an impressive 165% over the last five years. It's also good to see the share price up 24% over the last quarter. But this move may well have been assisted by the reasonably buoyant market (up 13% in 90 days).
Since it's been a strong week for Sundram Fasteners shareholders, let's have a look at trend of the longer term fundamentals.
View our latest analysis for Sundram Fasteners
To paraphrase Benjamin Graham: Over the short term the market is a voting machine, but over the long term it's a weighing machine. One imperfect but simple way to consider how the market perception of a company has shifted is to compare the change in the earnings per share (EPS) with the share price movement.
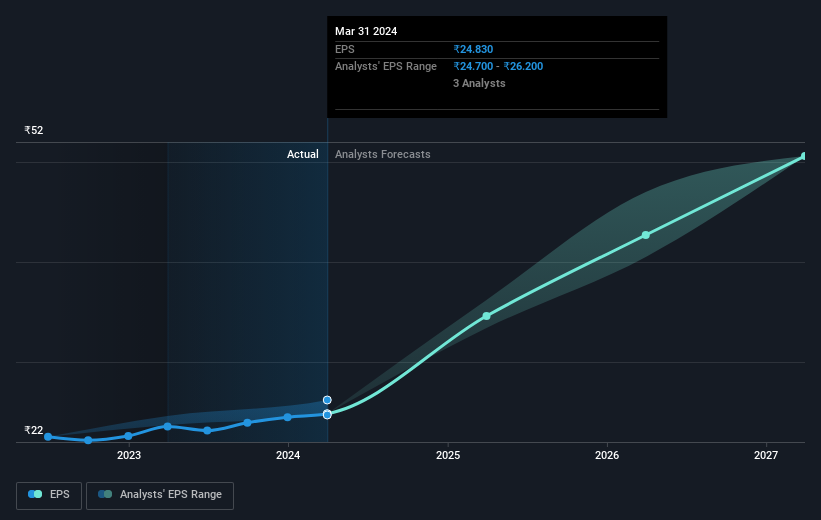
During five years of share price growth, Sundram Fasteners achieved compound earnings per share (EPS) growth of 2.7% per year. This EPS growth is slower than the share price growth of 22% per year, over the same period. This suggests that market participants hold the company in higher regard, these days. And that's hardly shocking given the track record of growth. This favorable sentiment is reflected in its (fairly optimistic) P/E ratio of 54.50.
The company's earnings per share (over time) is depicted in the image below (click to see the exact numbers).
Before buying or selling a stock, we always recommend a close examination of historic growth trends, available here.
What About Dividends?
It is important to consider the total shareholder return, as well as the share price return, for any given stock. The TSR incorporates the value of any spin-offs or discounted capital raisings, along with any dividends, based on the assumption that the dividends are reinvested. So for companies that pay a generous dividend, the TSR is often a lot higher than the share price return. We note that for Sundram Fasteners the TSR over the last 5 years was 176%, which is better than the share price return mentioned above. And there's no prize for guessing that the dividend payments largely explain the divergence!
A Different Perspective
Sundram Fasteners provided a TSR of 12% over the last twelve months. But that return falls short of the market. If we look back over five years, the returns are even better, coming in at 23% per year for five years. Maybe the share price is just taking a breather while the business executes on its growth strategy. While it is well worth considering the different impacts that market conditions can have on the share price, there are other factors that are even more important. Take risks, for example - Sundram Fasteners has 1 warning sign we think you should be aware of.
We will like Sundram Fasteners better if we see some big insider buys. While we wait, check out this free list of undervalued stocks (mostly small caps) with considerable, recent, insider buying.
Please note, the market returns quoted in this article reflect the market weighted average returns of stocks that currently trade on Indian exchanges.
Valuation is complex, but we're helping make it simple.
Find out whether Sundram Fasteners is potentially over or undervalued by checking out our comprehensive analysis, which includes fair value estimates, risks and warnings, dividends, insider transactions and financial health.
View the Free AnalysisHave feedback on this article? Concerned about the content? Get in touch with us directly. Alternatively, email editorial-team (at) simplywallst.com.
This article by Simply Wall St is general in nature. We provide commentary based on historical data and analyst forecasts only using an unbiased methodology and our articles are not intended to be financial advice. It does not constitute a recommendation to buy or sell any stock, and does not take account of your objectives, or your financial situation. We aim to bring you long-term focused analysis driven by fundamental data. Note that our analysis may not factor in the latest price-sensitive company announcements or qualitative material. Simply Wall St has no position in any stocks mentioned.
Valuation is complex, but we're helping make it simple.
Find out whether Sundram Fasteners is potentially over or undervalued by checking out our comprehensive analysis, which includes fair value estimates, risks and warnings, dividends, insider transactions and financial health.
View the Free AnalysisHave feedback on this article? Concerned about the content? Get in touch with us directly. Alternatively, email editorial-team@simplywallst.com
About NSEI:SUNDRMFAST
Sundram Fasteners
Manufactures and sells precision components for the automotive, infrastructure, windmill, and aviation sectors in India, China, Germany, the United States, the United Kingdom, Italy, France, and Brazil.
Flawless balance sheet with high growth potential and pays a dividend.
