
Advertisement
- India
- /
- Auto Components
- /
- NSEI:SUNDRMBRAK
Sundaram Brake Linings Limited's (NSE:SUNDRMBRAK) Popularity With Investors Under Threat As Stock Sinks 26%
Sundaram Brake Linings Limited (NSE:SUNDRMBRAK) shares have retraced a considerable 26% in the last month, reversing a fair amount of their solid recent performance. Longer-term, the stock has been solid despite a difficult 30 days, gaining 19% in the last year.
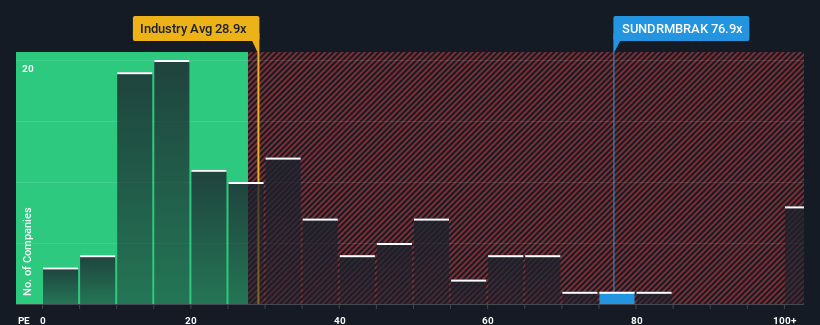
In spite of the heavy fall in price, given close to half the companies in India have price-to-earnings ratios (or "P/E's") below 26x, you may still consider Sundaram Brake Linings as a stock to avoid entirely with its 76.9x P/E ratio. However, the P/E might be quite high for a reason and it requires further investigation to determine if it's justified.
For example, consider that Sundaram Brake Linings' financial performance has been poor lately as its earnings have been in decline. One possibility is that the P/E is high because investors think the company will still do enough to outperform the broader market in the near future. If not, then existing shareholders may be quite nervous about the viability of the share price.
See our latest analysis for Sundaram Brake Linings
Does Growth Match The High P/E?
Sundaram Brake Linings' P/E ratio would be typical for a company that's expected to deliver very strong growth, and importantly, perform much better than the market.
Taking a look back first, the company's earnings per share growth last year wasn't something to get excited about as it posted a disappointing decline of 62%. This has erased any of its gains during the last three years, with practically no change in EPS being achieved in total. Therefore, it's fair to say that earnings growth has been inconsistent recently for the company.
This is in contrast to the rest of the market, which is expected to grow by 25% over the next year, materially higher than the company's recent medium-term annualised growth rates.
In light of this, it's alarming that Sundaram Brake Linings' P/E sits above the majority of other companies. It seems most investors are ignoring the fairly limited recent growth rates and are hoping for a turnaround in the company's business prospects. There's a good chance existing shareholders are setting themselves up for future disappointment if the P/E falls to levels more in line with recent growth rates.
The Bottom Line On Sundaram Brake Linings' P/E
A significant share price dive has done very little to deflate Sundaram Brake Linings' very lofty P/E. It's argued the price-to-earnings ratio is an inferior measure of value within certain industries, but it can be a powerful business sentiment indicator.
We've established that Sundaram Brake Linings currently trades on a much higher than expected P/E since its recent three-year growth is lower than the wider market forecast. When we see weak earnings with slower than market growth, we suspect the share price is at risk of declining, sending the high P/E lower. Unless the recent medium-term conditions improve markedly, it's very challenging to accept these prices as being reasonable.
Having said that, be aware Sundaram Brake Linings is showing 4 warning signs in our investment analysis, and 2 of those don't sit too well with us.
Of course, you might find a fantastic investment by looking at a few good candidates. So take a peek at this free list of companies with a strong growth track record, trading on a low P/E.
New: Manage All Your Stock Portfolios in One Place
We've created the ultimate portfolio companion for stock investors, and it's free.
• Connect an unlimited number of Portfolios and see your total in one currency
• Be alerted to new Warning Signs or Risks via email or mobile
• Track the Fair Value of your stocks
Have feedback on this article? Concerned about the content? Get in touch with us directly. Alternatively, email editorial-team (at) simplywallst.com.
This article by Simply Wall St is general in nature. We provide commentary based on historical data and analyst forecasts only using an unbiased methodology and our articles are not intended to be financial advice. It does not constitute a recommendation to buy or sell any stock, and does not take account of your objectives, or your financial situation. We aim to bring you long-term focused analysis driven by fundamental data. Note that our analysis may not factor in the latest price-sensitive company announcements or qualitative material. Simply Wall St has no position in any stocks mentioned.
About NSEI:SUNDRMBRAK
Sundaram Brake Linings
Manufactures and sells asbestos free friction materials in India and internationally.
Mediocre balance sheet and slightly overvalued.
Similar Companies
Market Insights

Advertisement
Community Narratives
MicroVision will explode future revenue by 380.37% with a vision towards success
Fair Value US$60.00|98.5% undervalued
TH
Community Contributor
The Indispensable Artery for a New North American Economy
Fair Value CA$132.87|2.3% undervalued
TI
Community Contributor